West of England Regional Priorities

Indicator charts

2026-10-06

Contents

Economic Growth

Contributing to national economic growth helping our businesses succeed and creating jobs

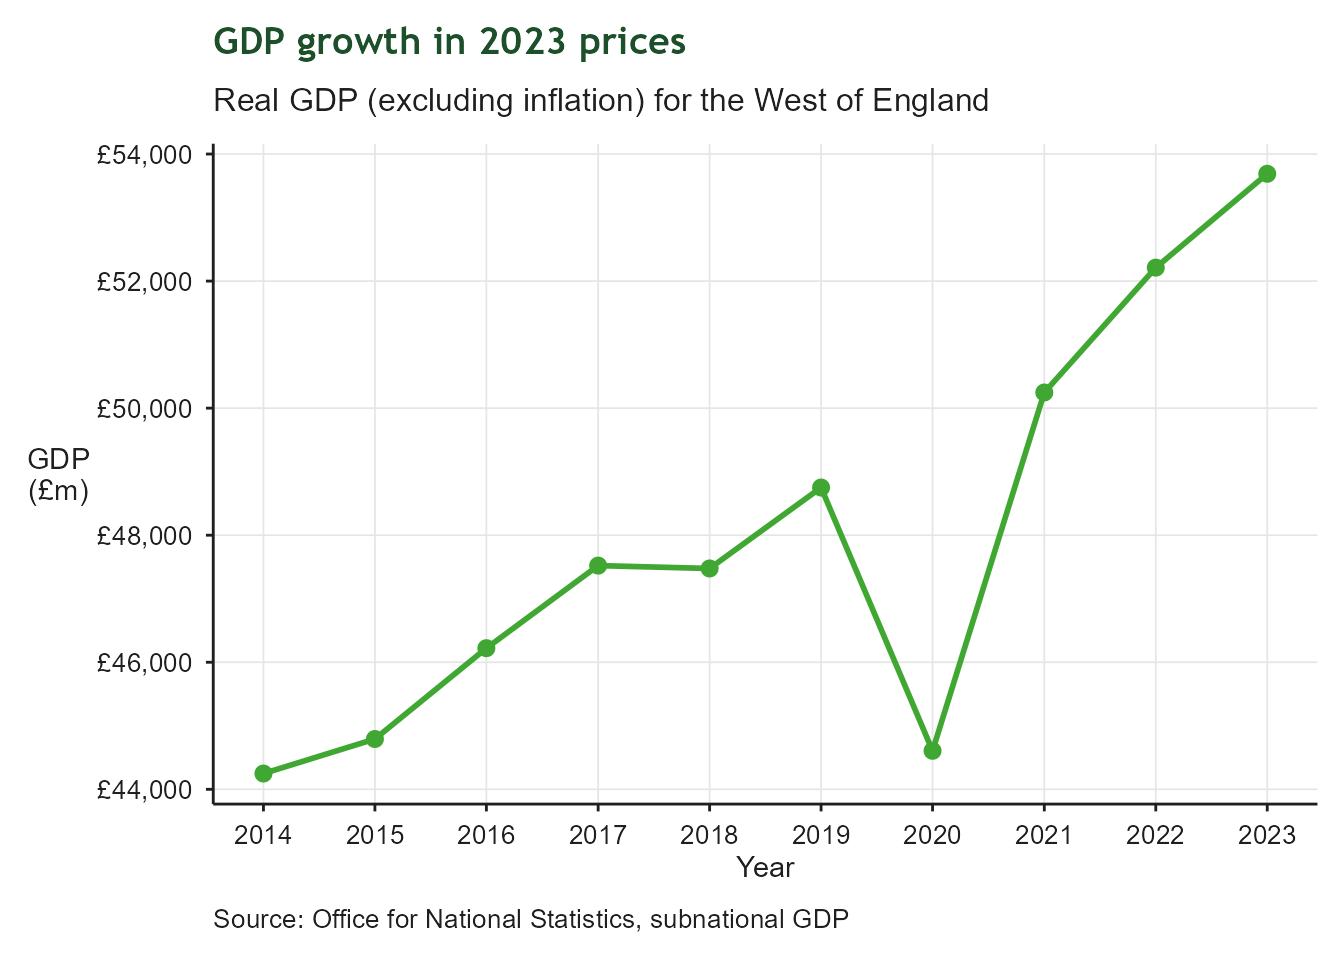
Real GDP growth rate

Line chart of a real GDP index for the West of England, 2014 to 2023 The line rises in most years, showing sustained growth in real GDP over the decade as the region tracks its target of a 28% increase.

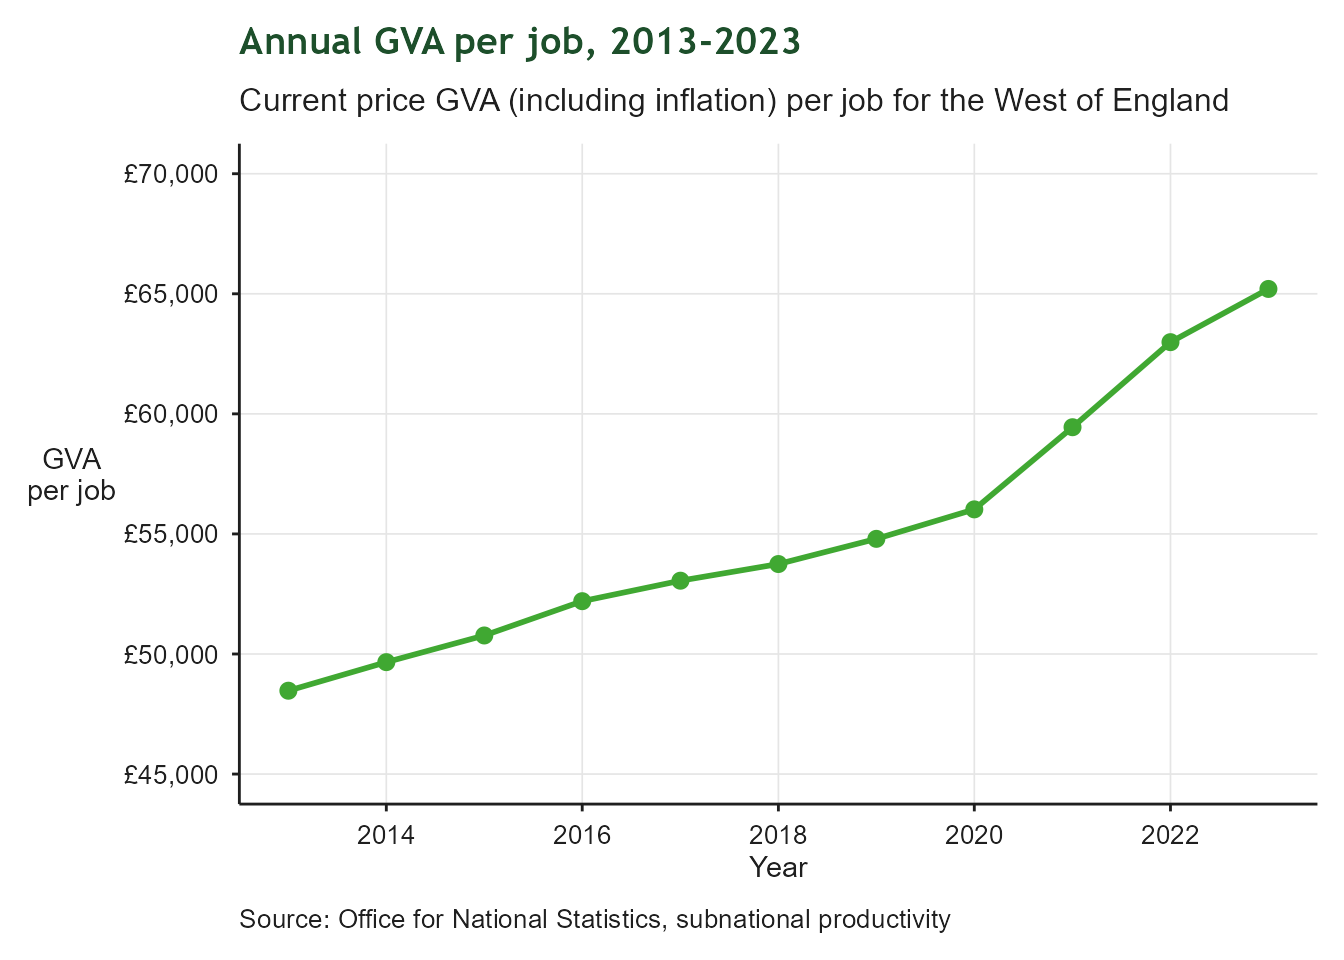
GVA per job

Line chart of annual current-price GVA per job in pounds for the West of England, 2013 to 2023. The line trends upward over the period, indicating rising productivity per worker across the region.

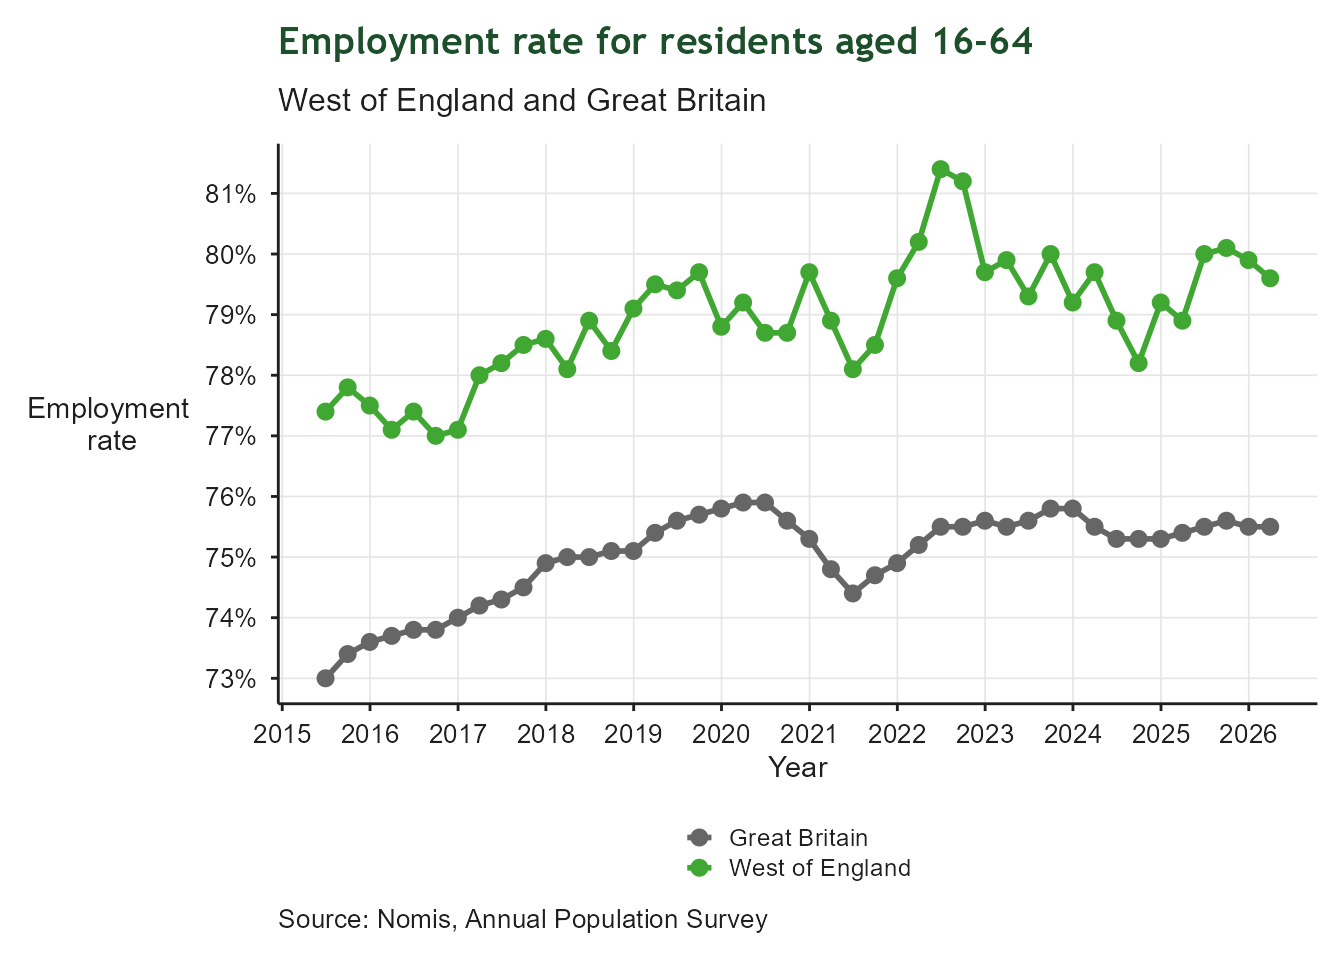
Employment Rate 16-64

Line chart of the employment rate for residents aged 16 to 64, shown as two lines: the West of England in green and Great Britain in grey, covering the latest available years. The two lines track closely together, with the West of England generally at or slightly above the Great Britain rate.

Employment level and growth for priority sectors
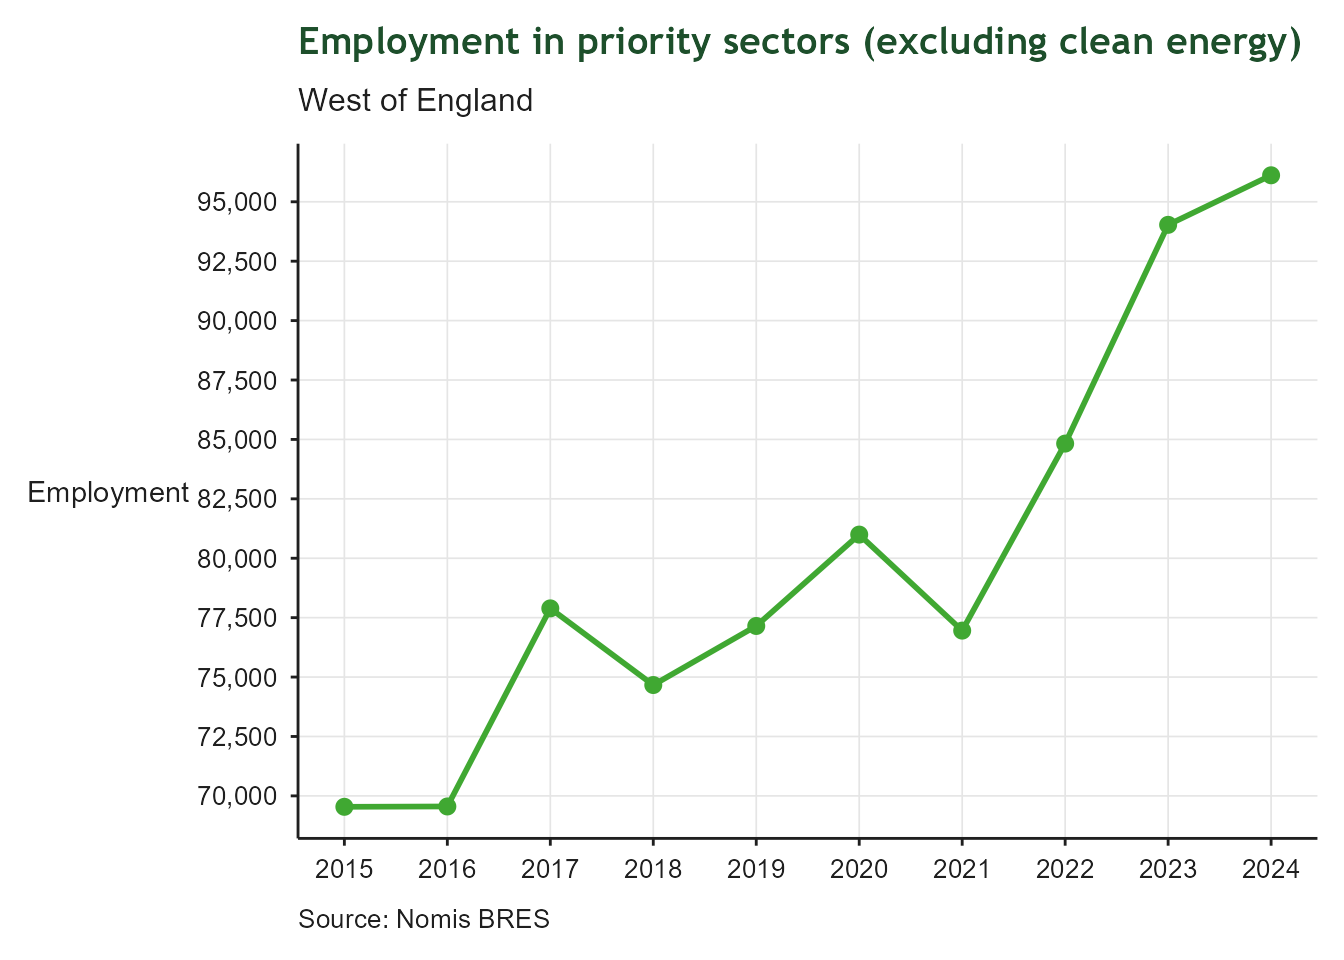
Line chart of total employment in priority sectors, excluding clean energy, for the West of England from 2015 to the most recent year. The line shows the region's progress towards its target of adding 72,000 priority sector jobs over 10 years.

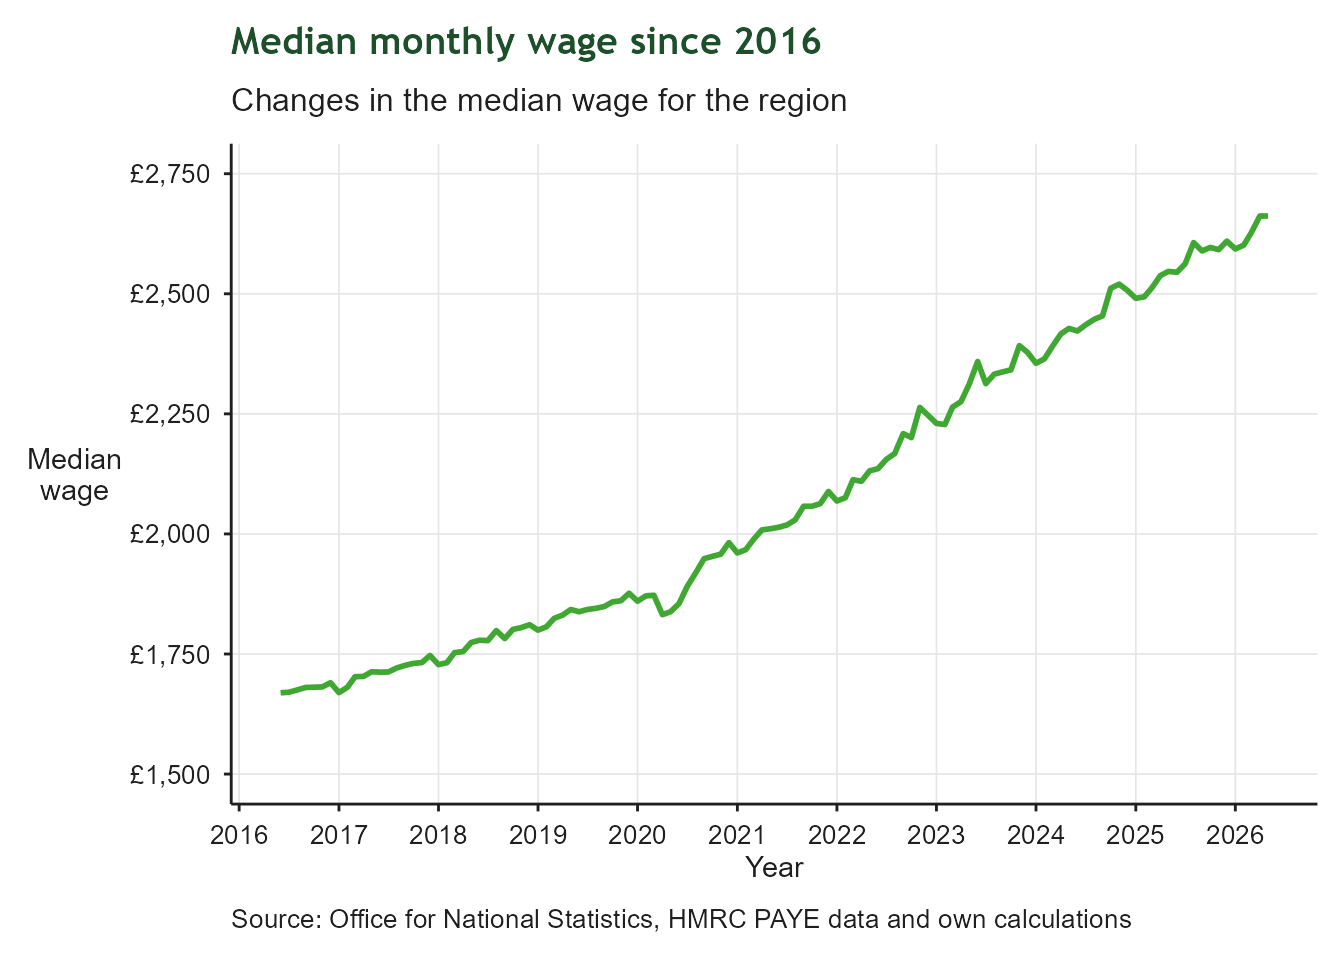
Gross monthly median wage

Line chart of the estimated median monthly wage in pounds for the West of England over the most recent 10 years. The line rises over time, showing wages increasing across the region, though this measure does not show how the increase is distributed between low and high earners.

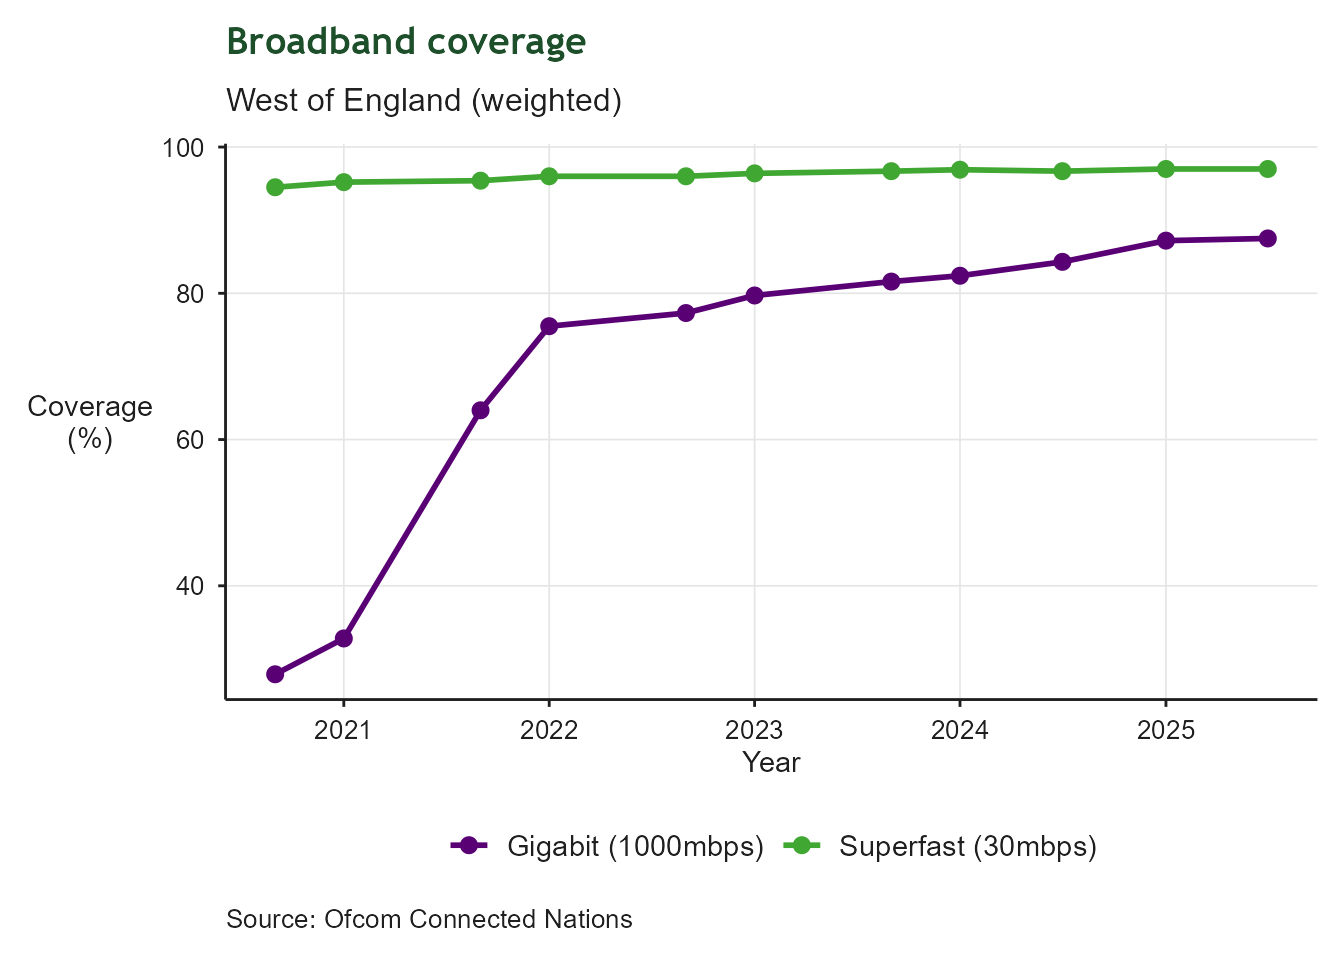
Broadband coverage

Line chart showing two coverage measures for the West of England over time: superfast broadband (30mbps+) in green and gigabit broadband (1000mbps+) in purple. Superfast coverage is consistently higher and close to full coverage, while gigabit coverage started lower but has been catching up in more recent years.

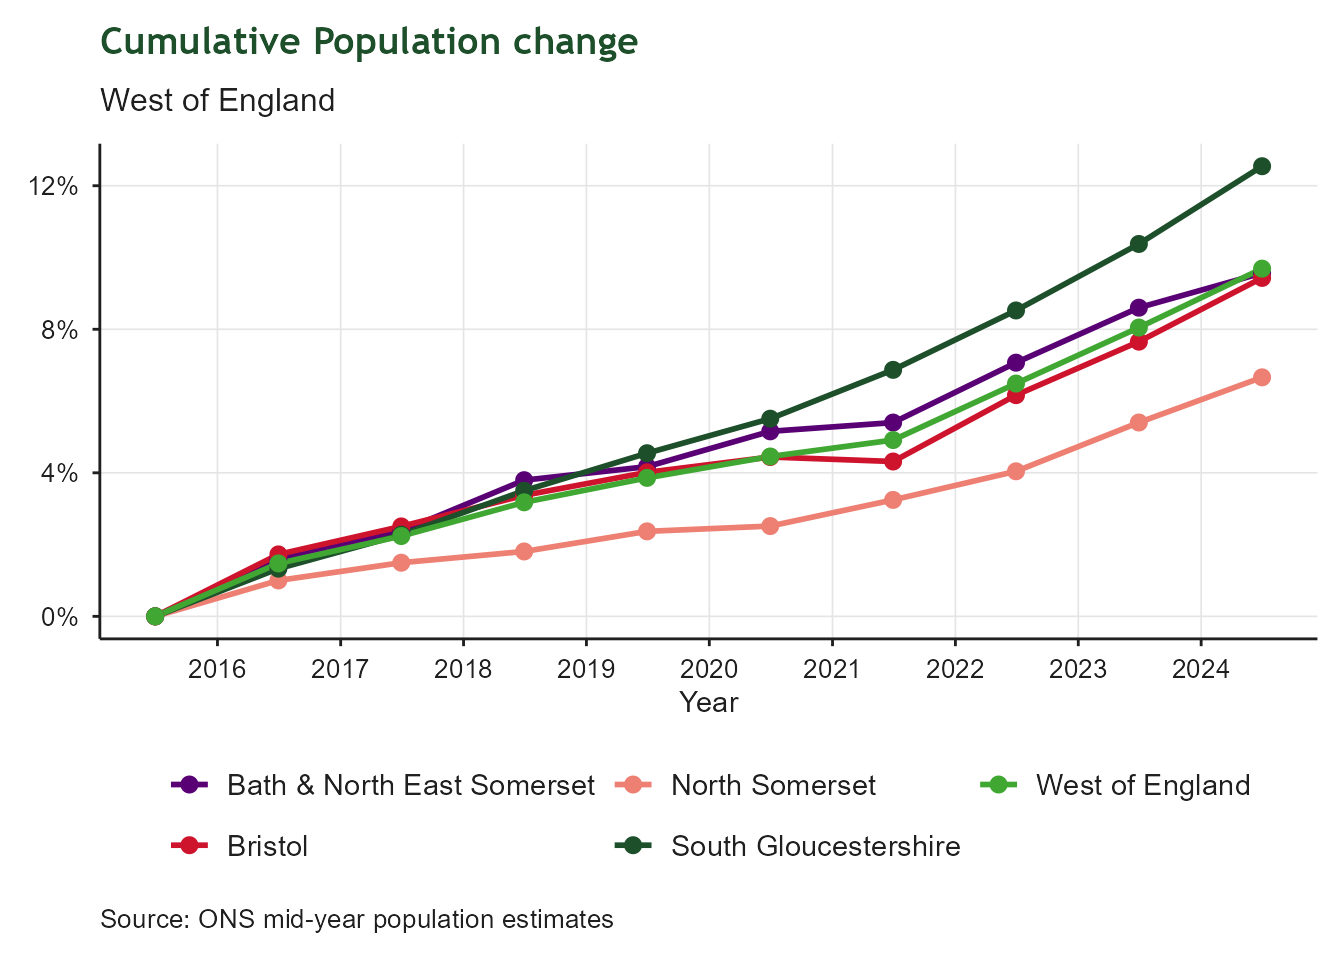
Population change

Line chart of cumulative percentage population change from 2016 to 2025, with separate coloured lines for Bath and North East Somerset, Bristol, North Somerset, South Gloucestershire, and the West of England total. All areas show a rising cumulative trend, with the individual authorities spread above and below the regional total.

Satisfaction with local area as a place to live
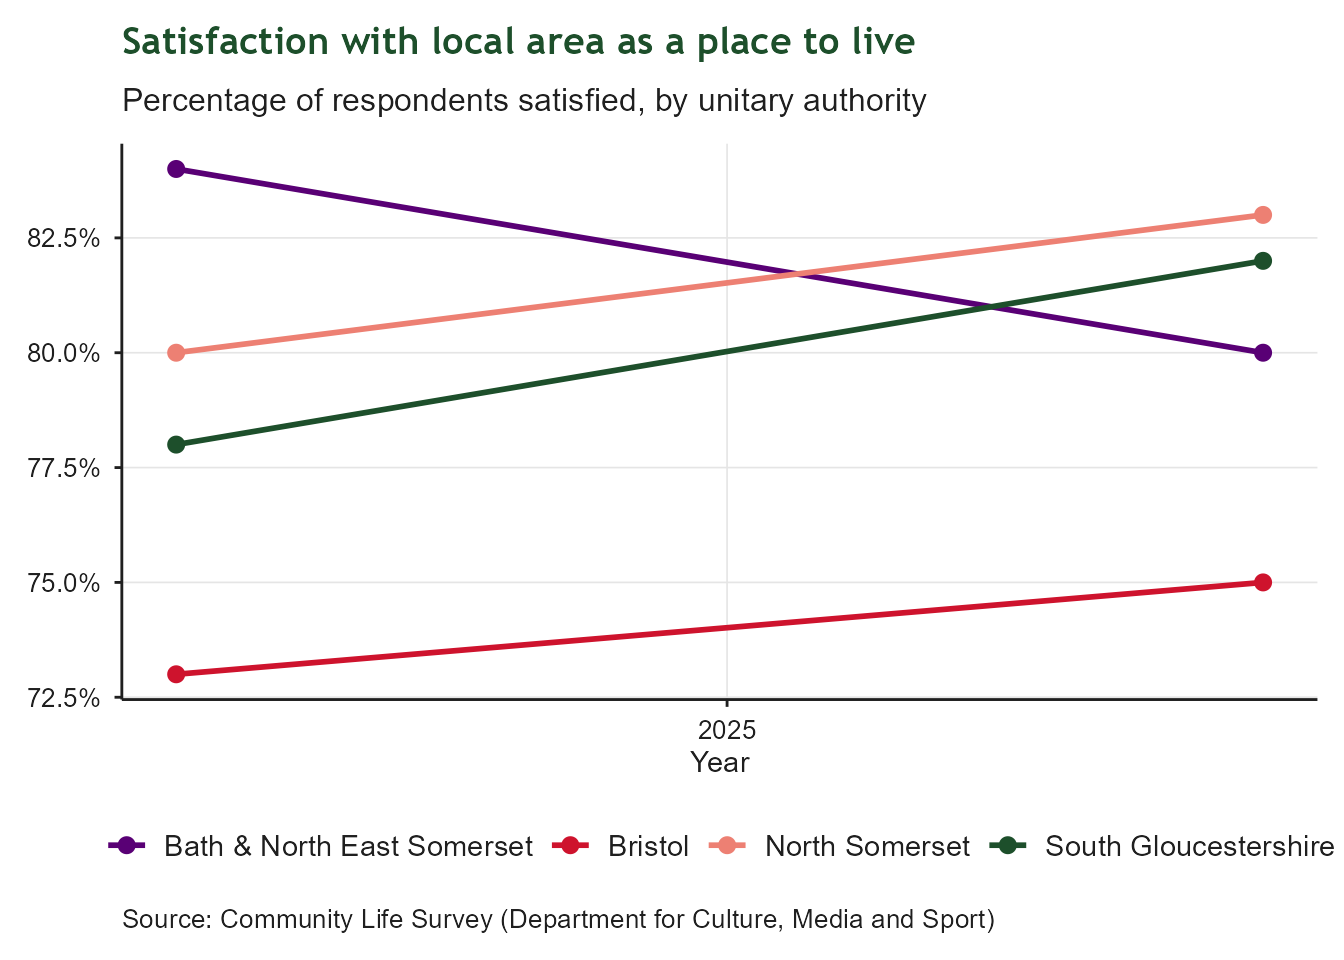
Line chart of the percentage of respondents satisfied with their local area as a place to live, with separate coloured lines for Bath and North East Somerset, Bristol, North Somerset, and South Gloucestershire over time. Satisfaction levels are broadly high across all four authorities, with some year-to-year variation between them.

Public Transport Connectivity

Connecting the region through public transport & active travel

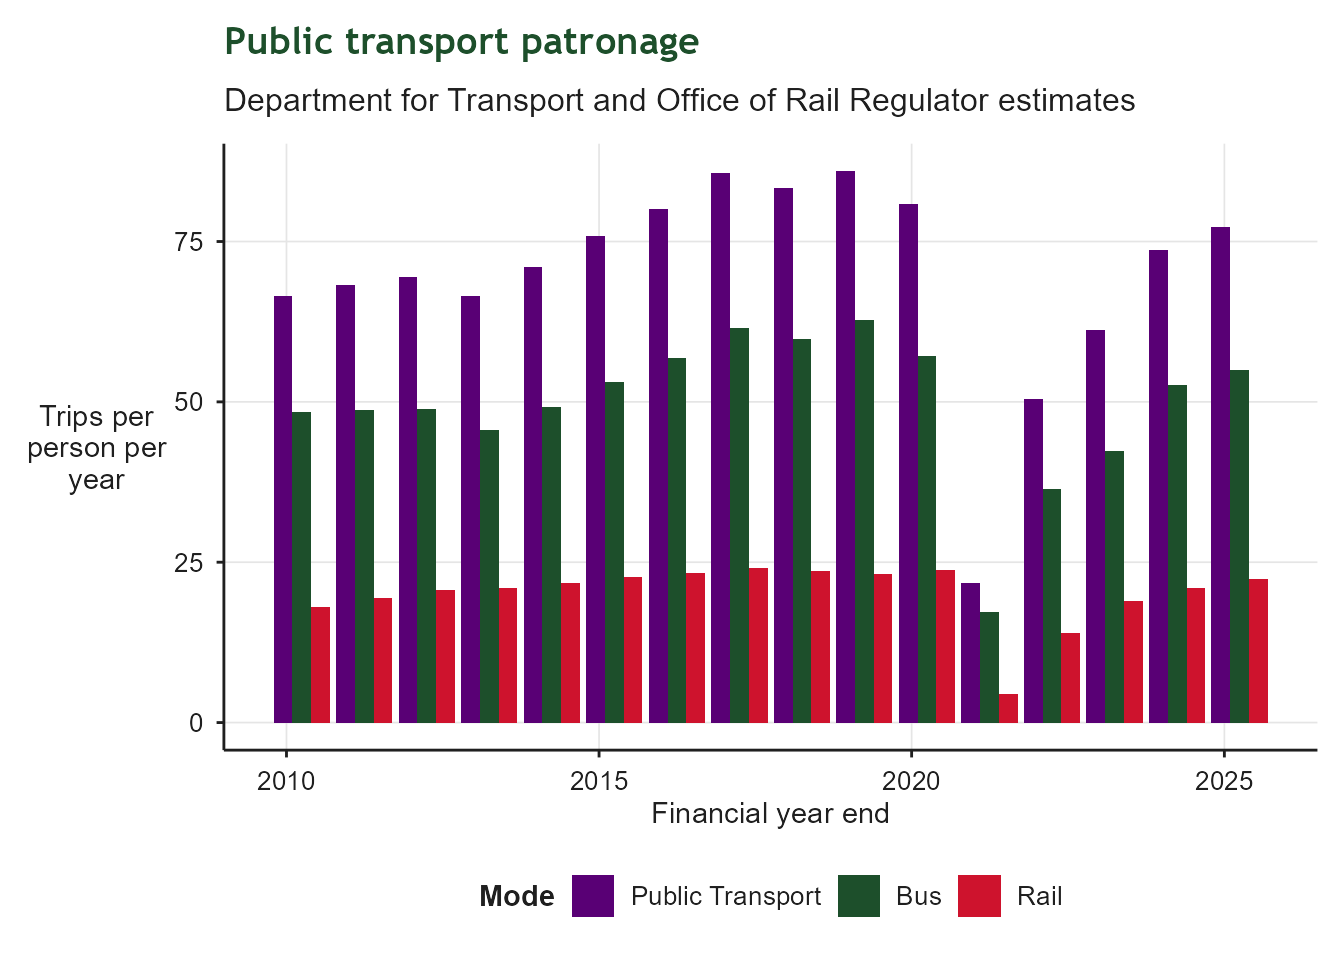
Public Transport Trips

Grouped bar chart of public transport trips per person per year, by financial year end. Bars compare bus, rail and total public transport trips per head using DfT/ORR estimates. This measure strips out population growth, so changes reflect real shifts in how often people use bus and rail services.

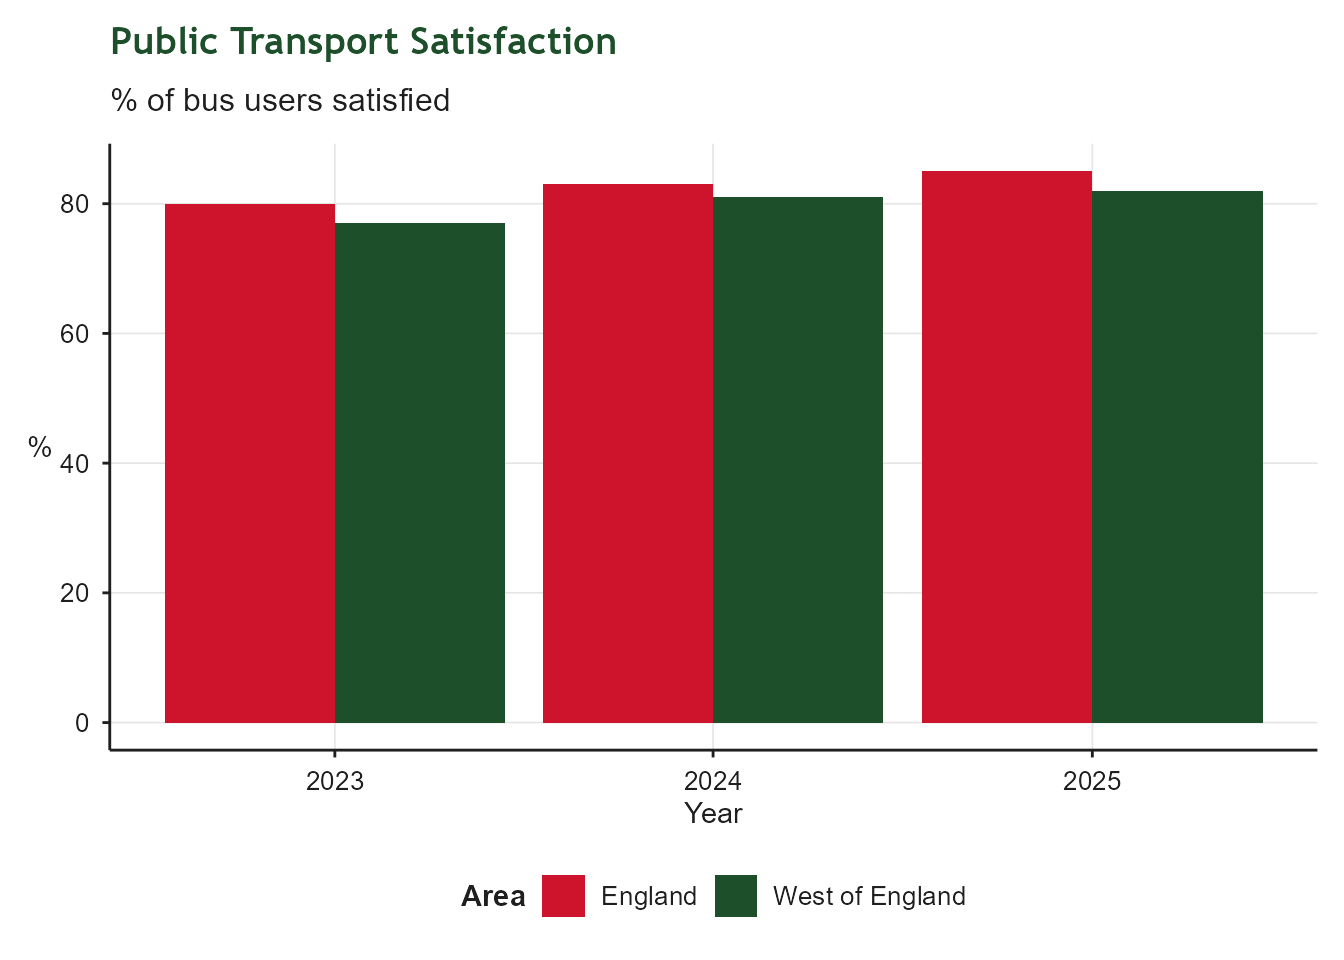
Bus Satisfaction

Grouped bar chart of bus satisfaction by year, comparing the percentage of bus users satisfied in the West of England against the England average. Satisfaction reflects factors such as punctuality, journey times, frequency and fares.

Bus - Satisfaction with Value for Money
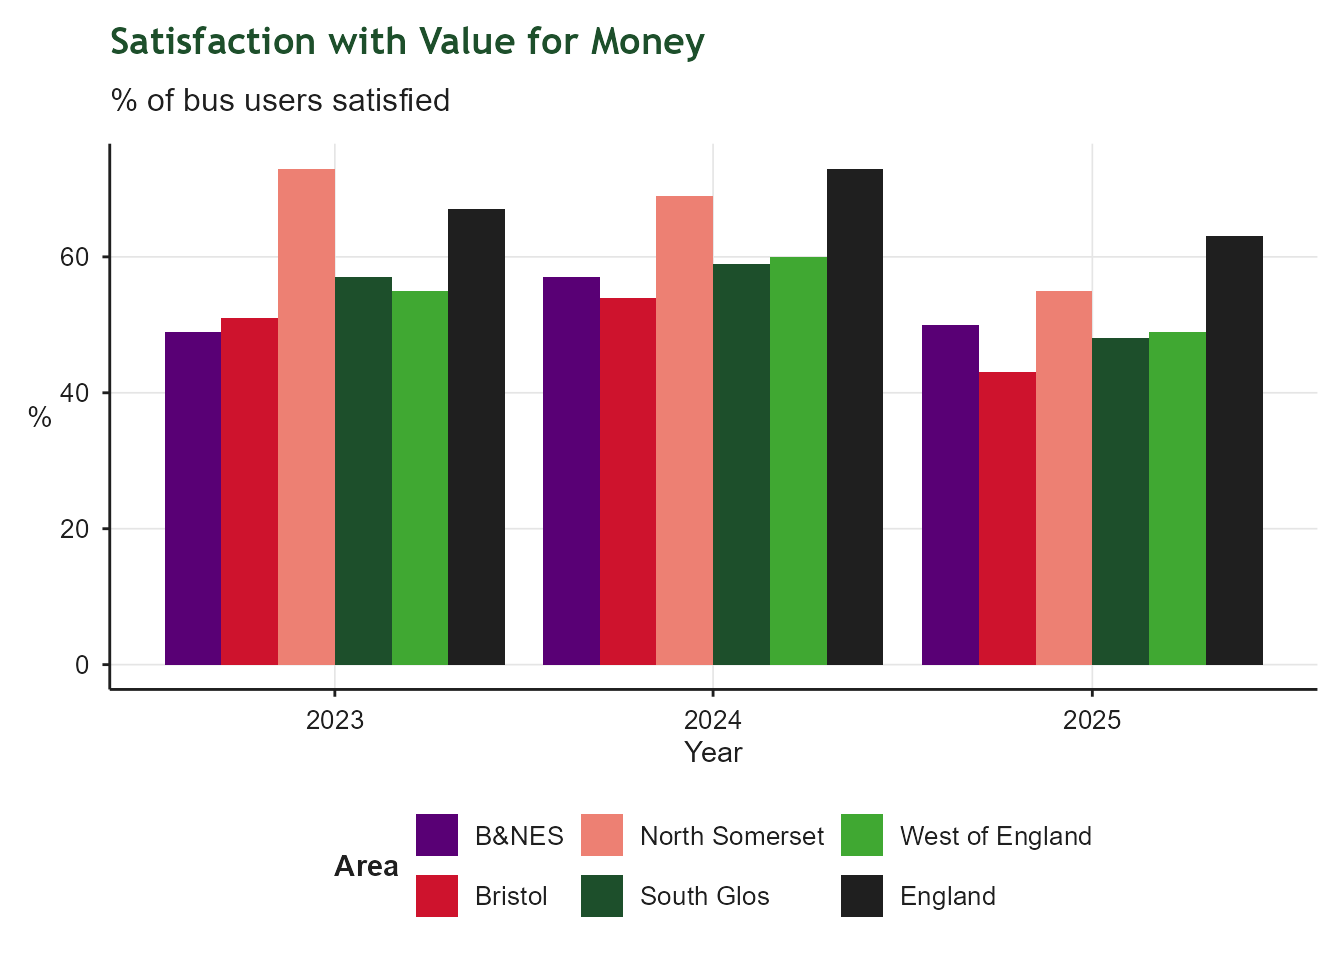
Grouped bar chart of satisfaction with bus value for money by year, with bars for each West of England unitary authority (B&NES, Bristol, North Somerset, South Glos), the West of England total and the England average. Based on fare-paying customer surveys, excluding concessionary pass holders.

Active Travel participation rates

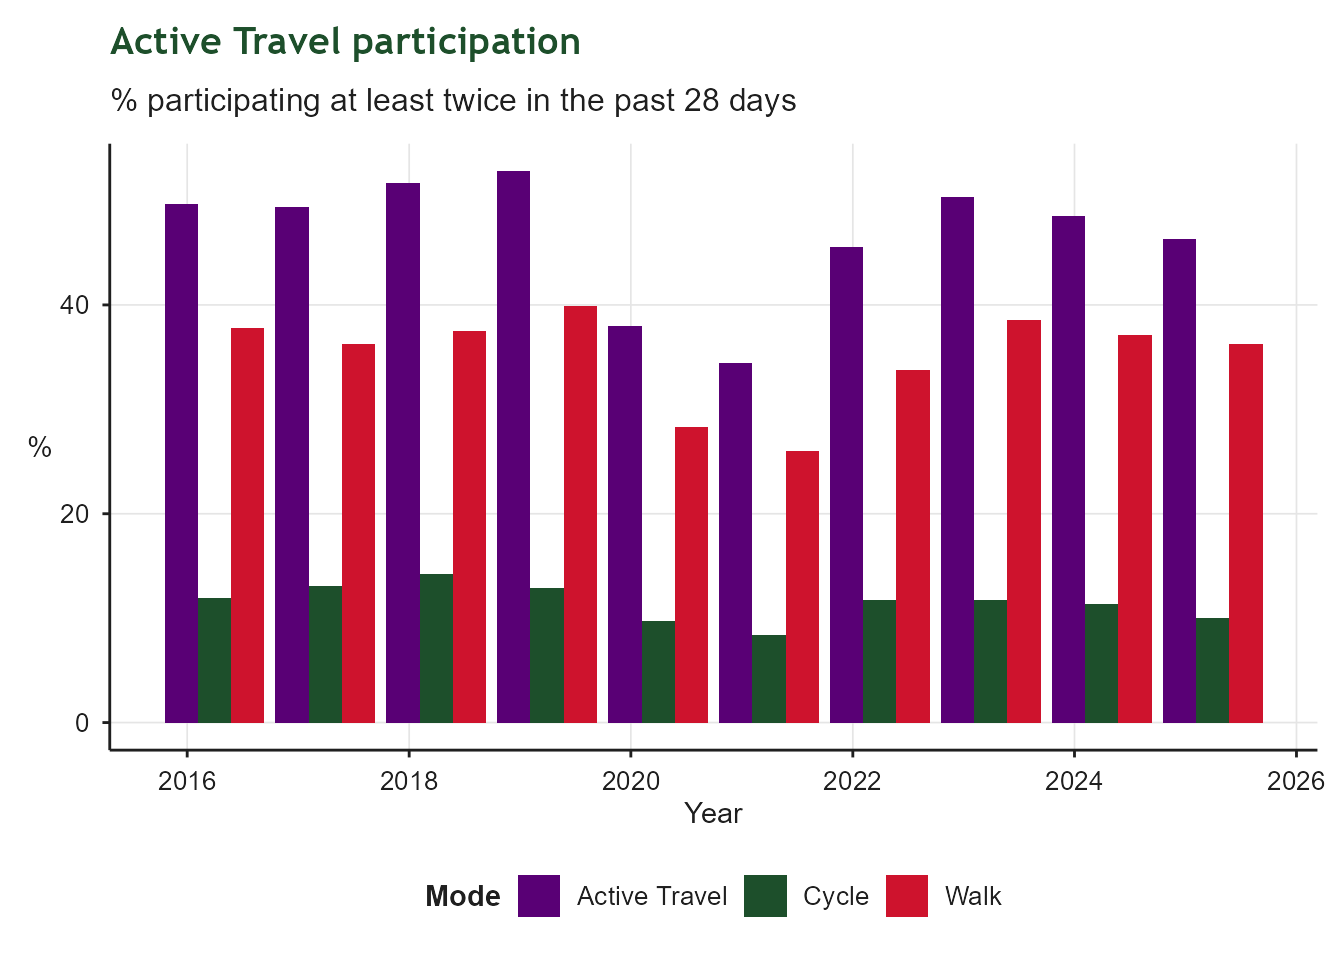
Grouped bar chart covering the last ten survey years, showing the percentage of people cycling, walking, and doing either at least twice in the past 28 days. Walking participation is consistently higher than cycling, and the combined active travel figure tracks the walking rate closely.

Active Travel Satisfaction

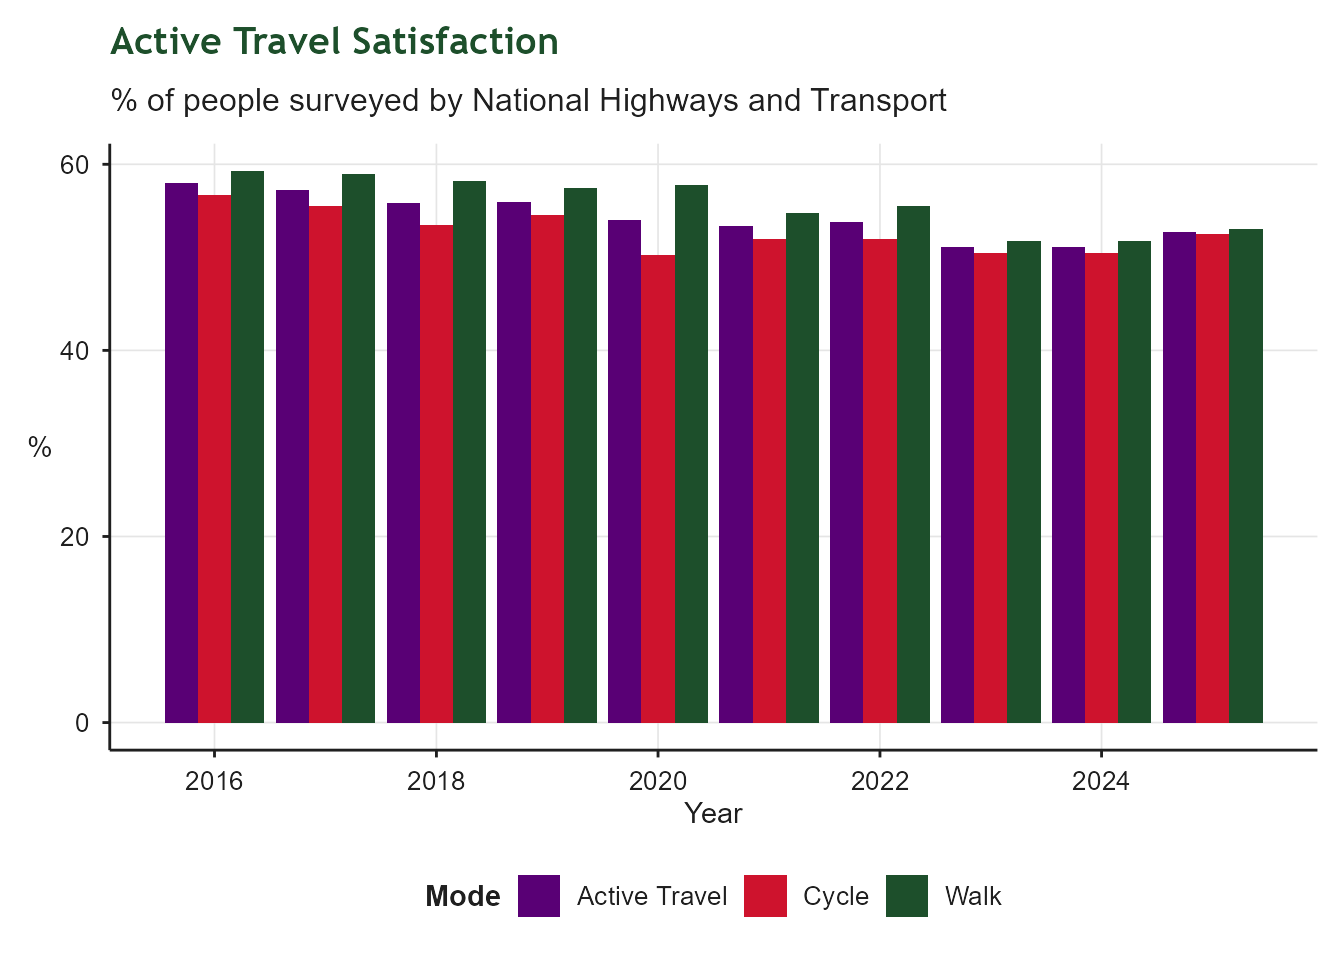
Grouped bar chart covering the last ten survey years, showing the percentage of the general public satisfied with walking routes, cycling routes, and an average of the two, from the NHT Public Satisfaction survey. This reflects general public opinion rather than the views of regular walkers or cyclists.

E-bike and E-scooter usage

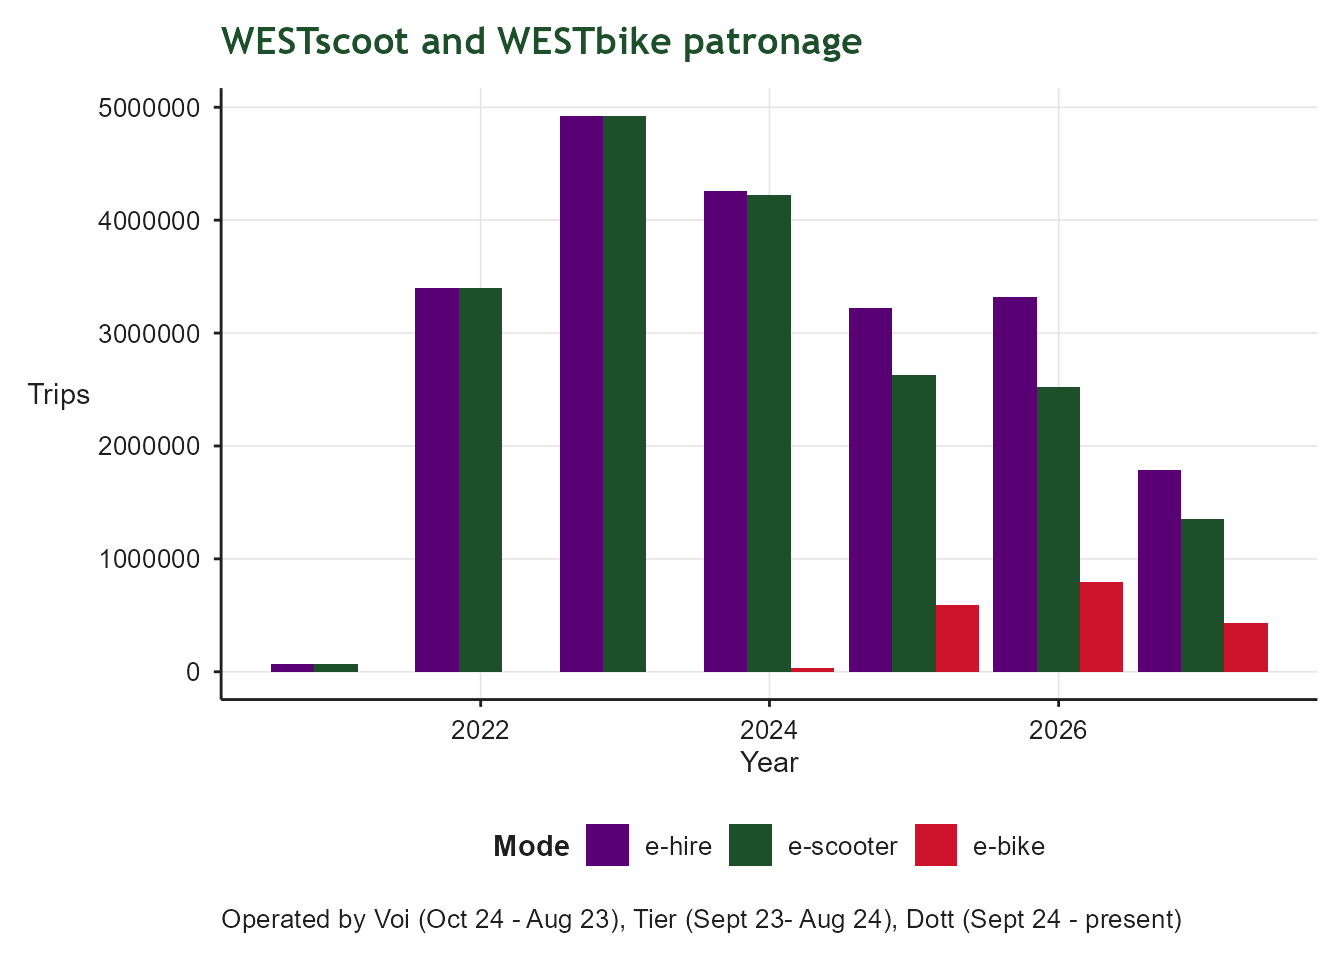
Grouped bar chart of annual e-scooter, e-bike and combined e-hire trips. Data is drawn from successive hire operators (Voi, Tier and Dott), so totals reflect a scheme that has continued to operate under different providers over time.

Public Transport Connectivity

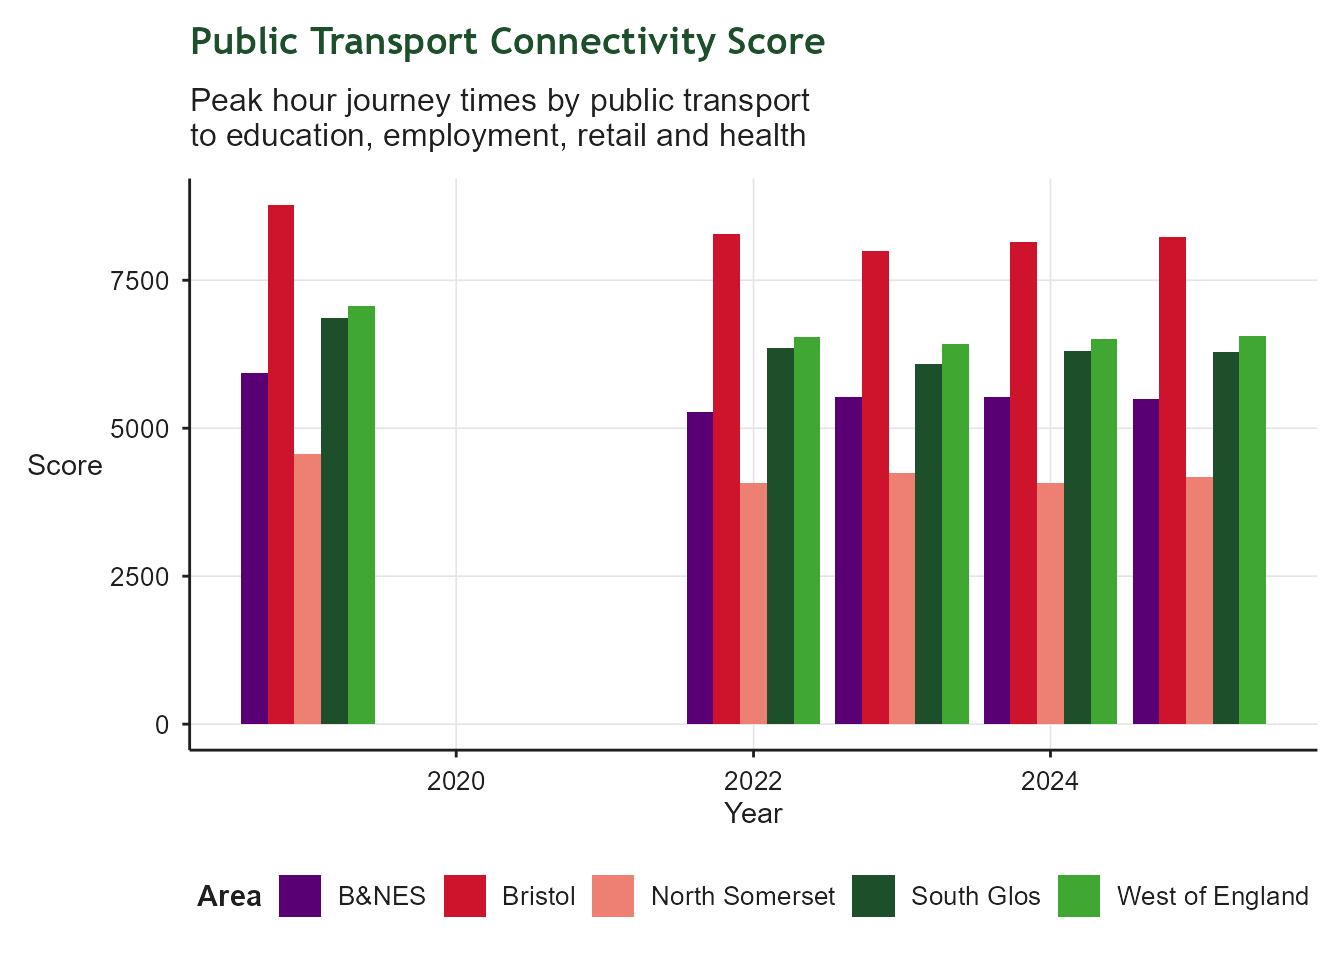
Grouped bar chart of public transport connectivity scores by year, with bars for each West of England unitary authority (B&NES, Bristol, North Somerset, South Glos) and the West of England total. Scores are modelled peak-hour journey times to education, employment, health and retail, and tend to be higher in more densely populated areas.

Journey Times to Employment

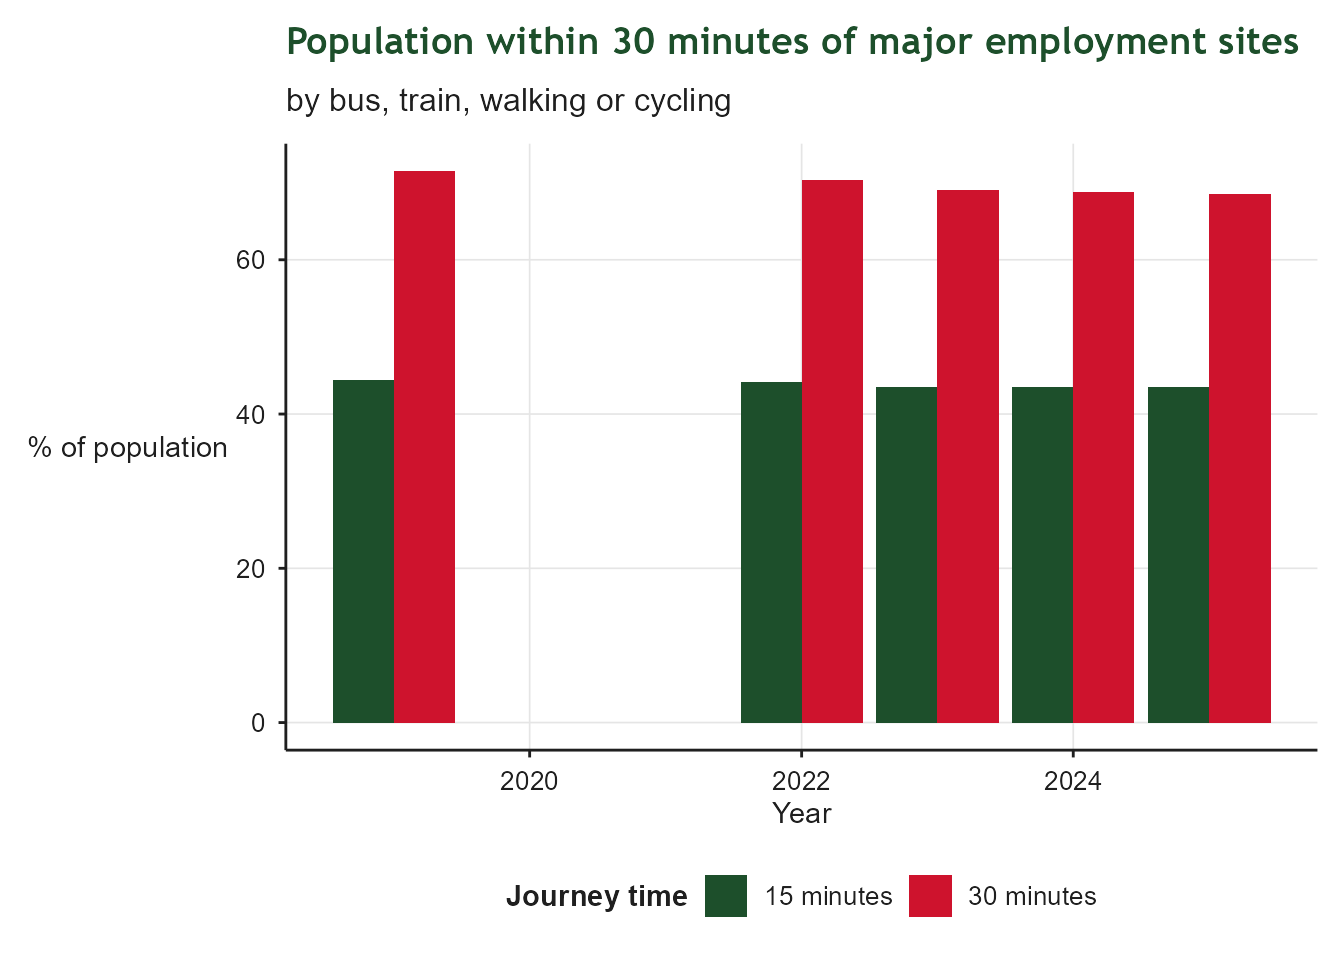
Grouped bar chart of the percentage of the population able to reach major employment sites (over 5000 employees) within 15 minutes and within 30 minutes, by year, using bus, train, walking or cycling. The 30-minute figure is consistently higher than the 15-minute figure, reflecting the wider catchment reachable at longer journey times.

Mode Share

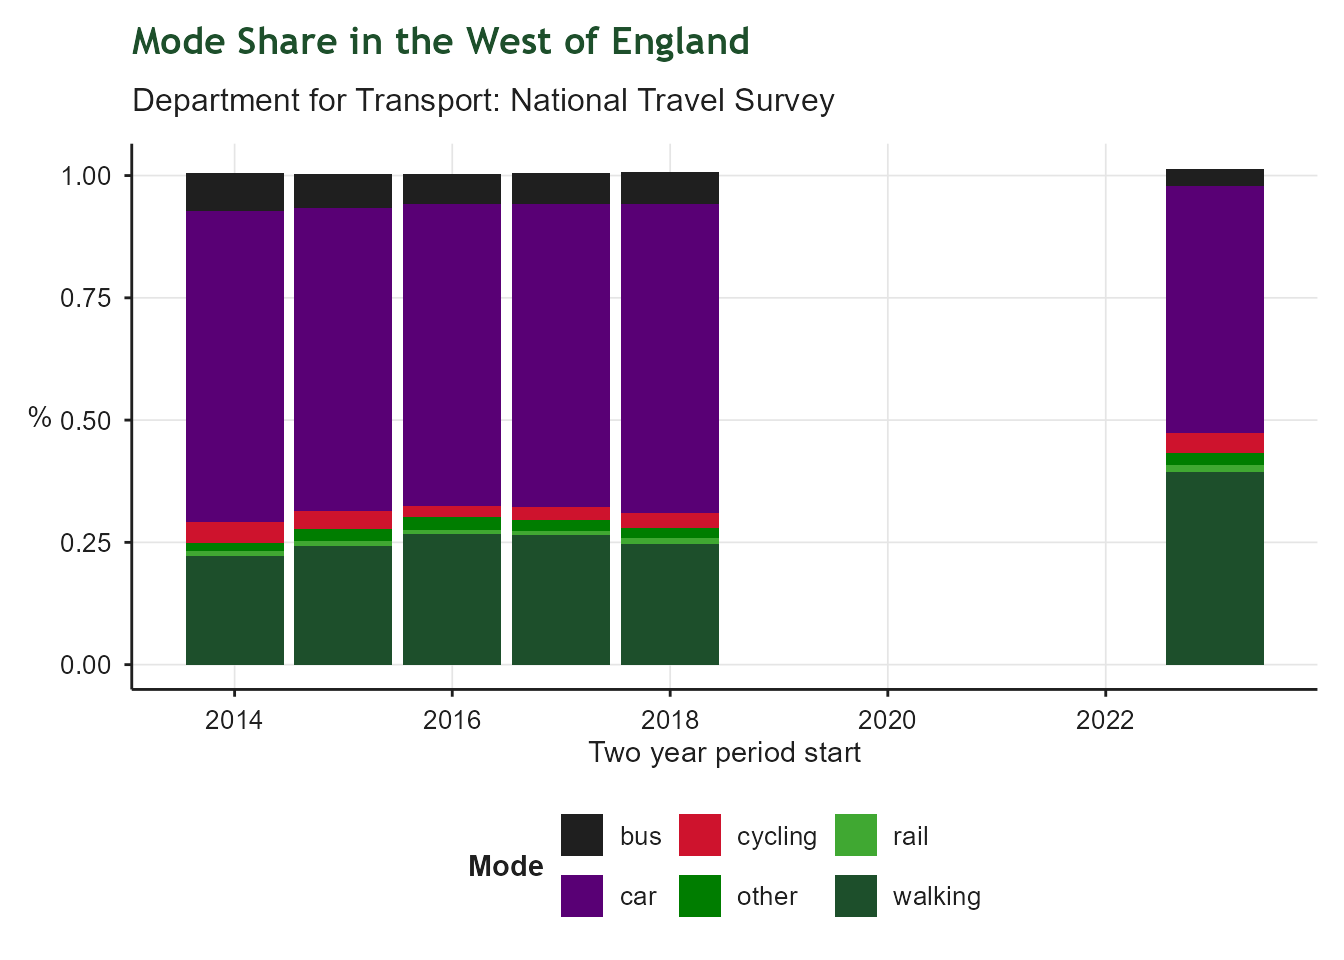
Stacked bar chart covering the last ten two-year periods, showing the percentage of trips made by walking, cycling, car, bus, rail and other modes, based on National Travel Survey data. Car remains the dominant mode in every period; recent years show an unexpected rise in walking and fall in car use that other local data sources do not corroborate, casting doubt on the reliability of the 2023 and 2024 NTS estimates.

Affordable and Sustainable Homes

Building affordable and attractive homes in sustainable communities

Net Additional Dwellings

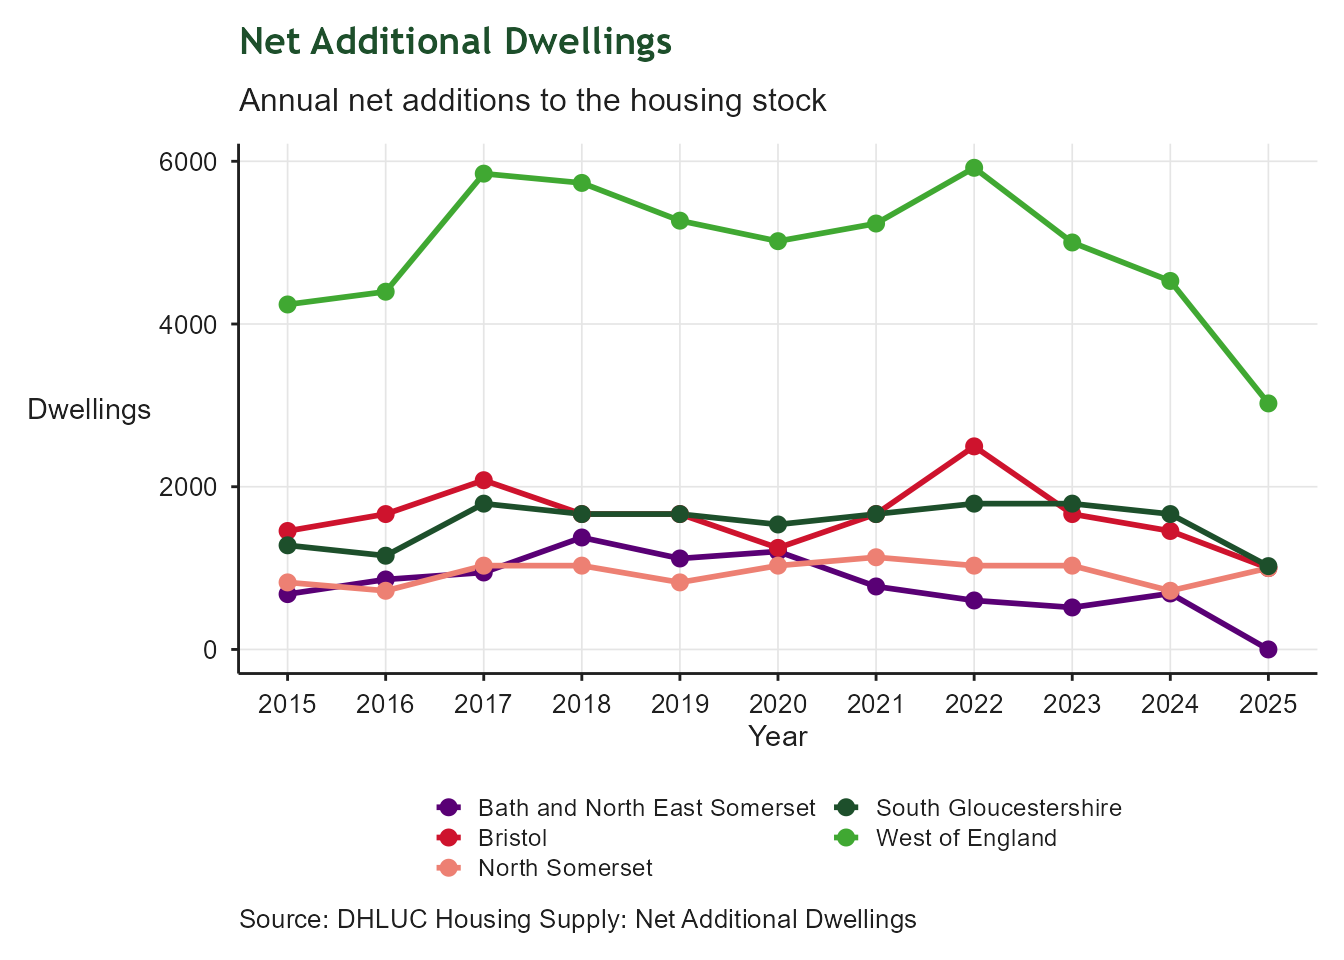
Line chart showing annual net additional dwellings for each unitary authority and the West of England total. The chart illustrates year-on-year variation in housing delivery and highlights periods of higher or lower growth in the regional housing stock.

Non-decent homes

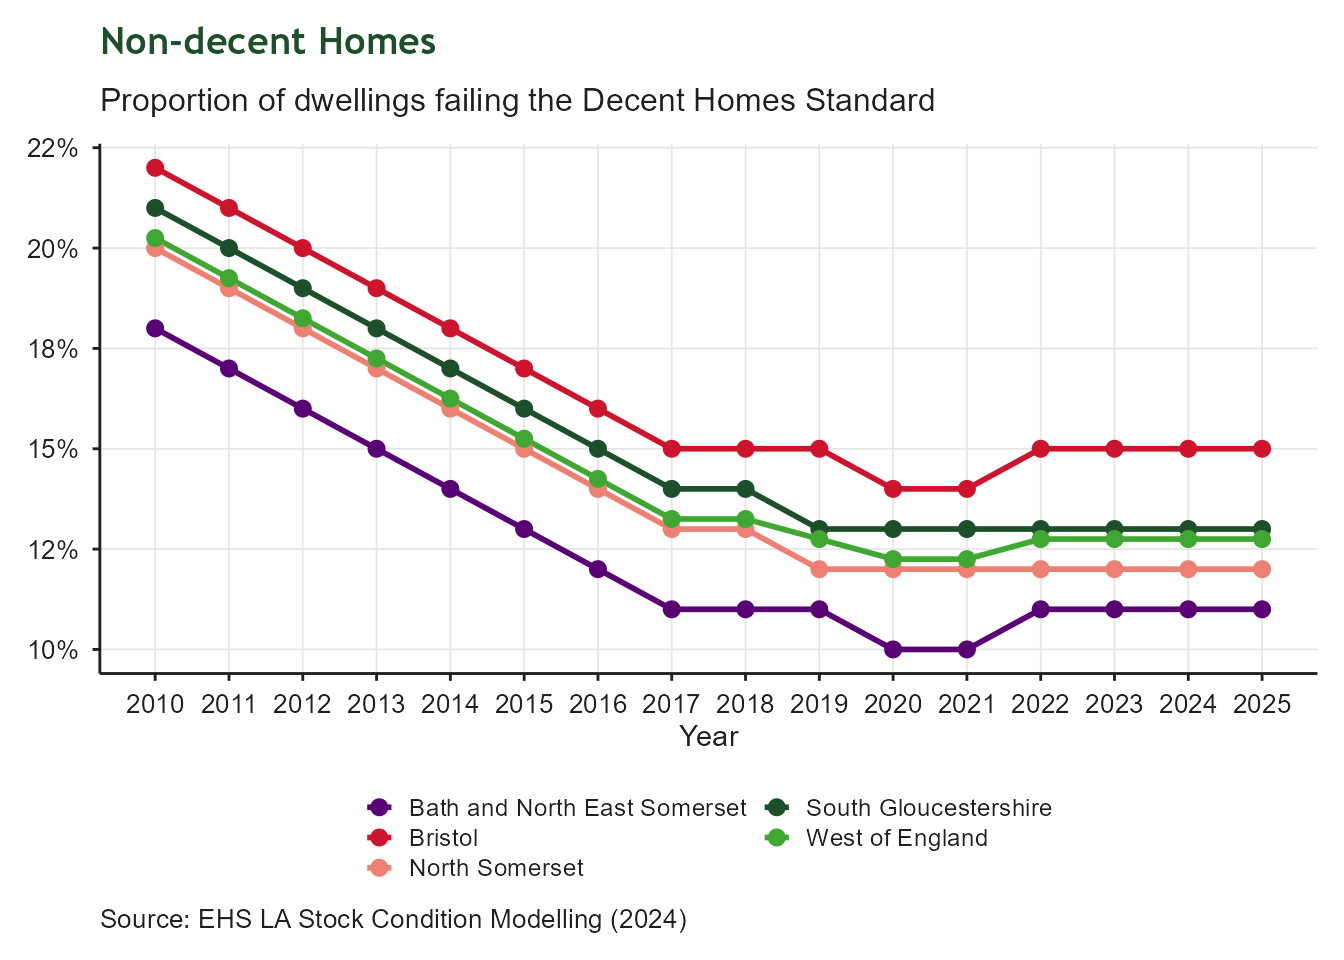
Line chart showing the proportion of non-decent homes across the West of England and its constituent unitary authorities from 2009/10 to 2024/25. The regional line reflects a dwelling-weighted mean of the four authorities.

Energy Performance of Homes

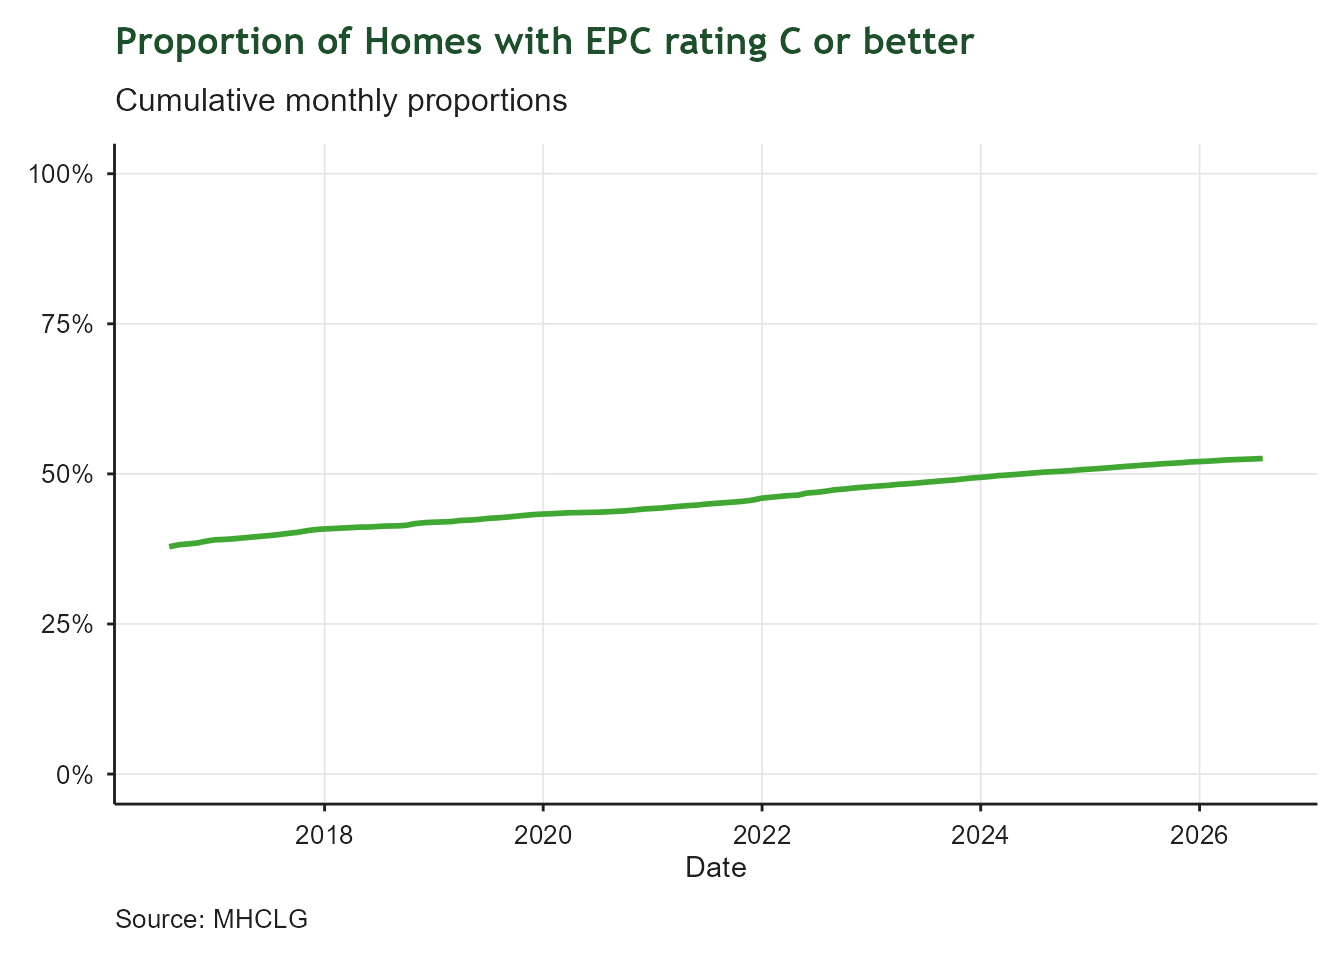
Line chart showing the cumulative monthly proportion of homes in the West of England with an EPC energy rating of C or better, from 2016 to 2026. The y-axis shows percentage from 0% to 100%; the x-axis shows date. The line rises steadily from around 36% in 2016 to approximately 53% in 2026, showing consistent improvement but indicating that nearly half of assessed homes still fall below a C rating.

House Price to Earnings Ratio

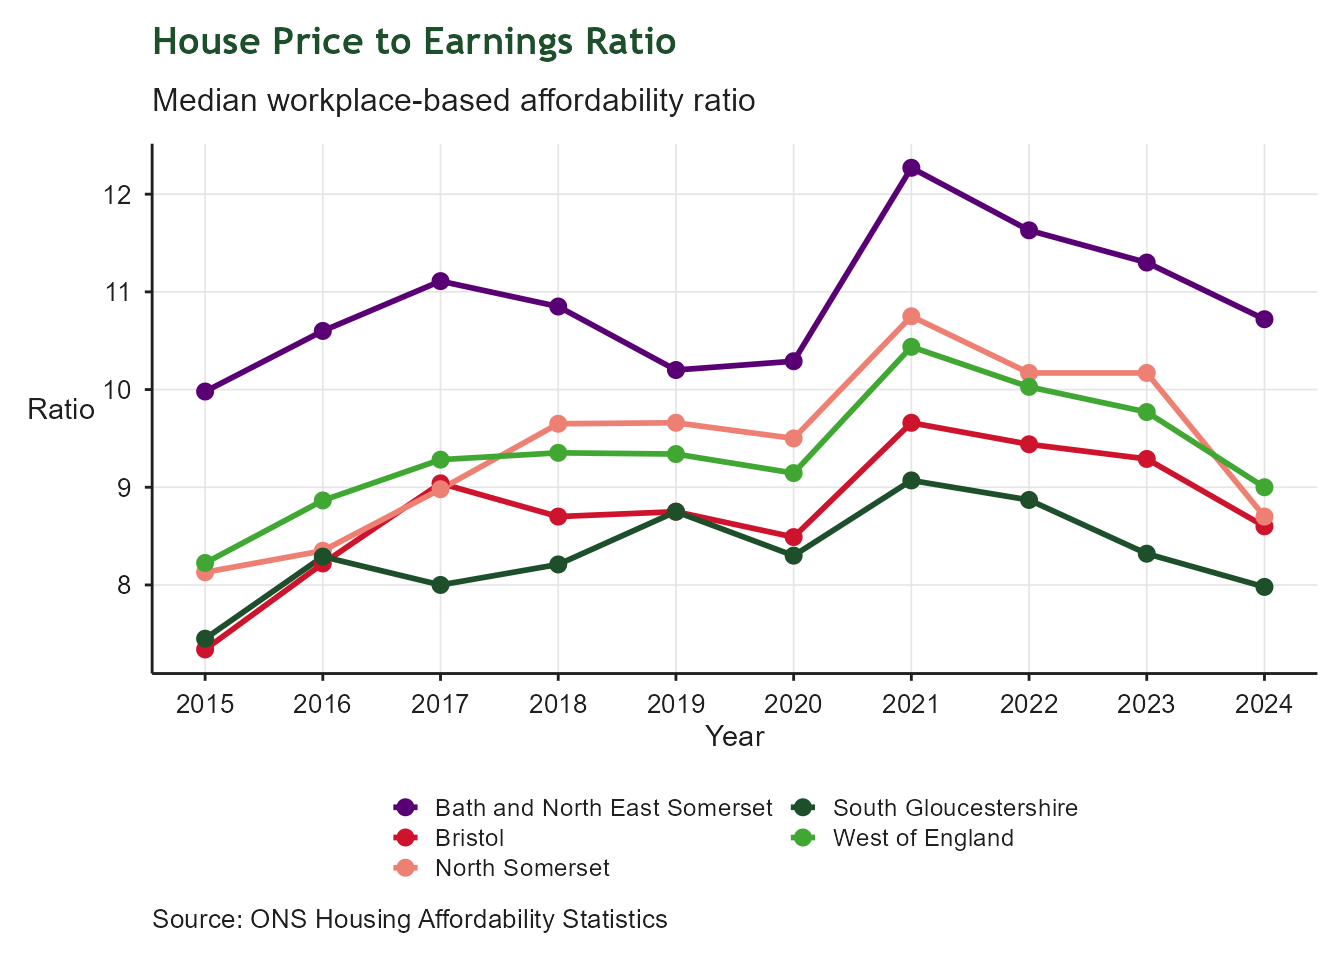
Line chart showing the house price to earnings ratio for each unitary authority and the West of England average over the most recent ten years. The y-axis shows the ratio of median house price to median workplace-based earnings; higher values mean housing is less affordable relative to local wages.

Rental Affordability

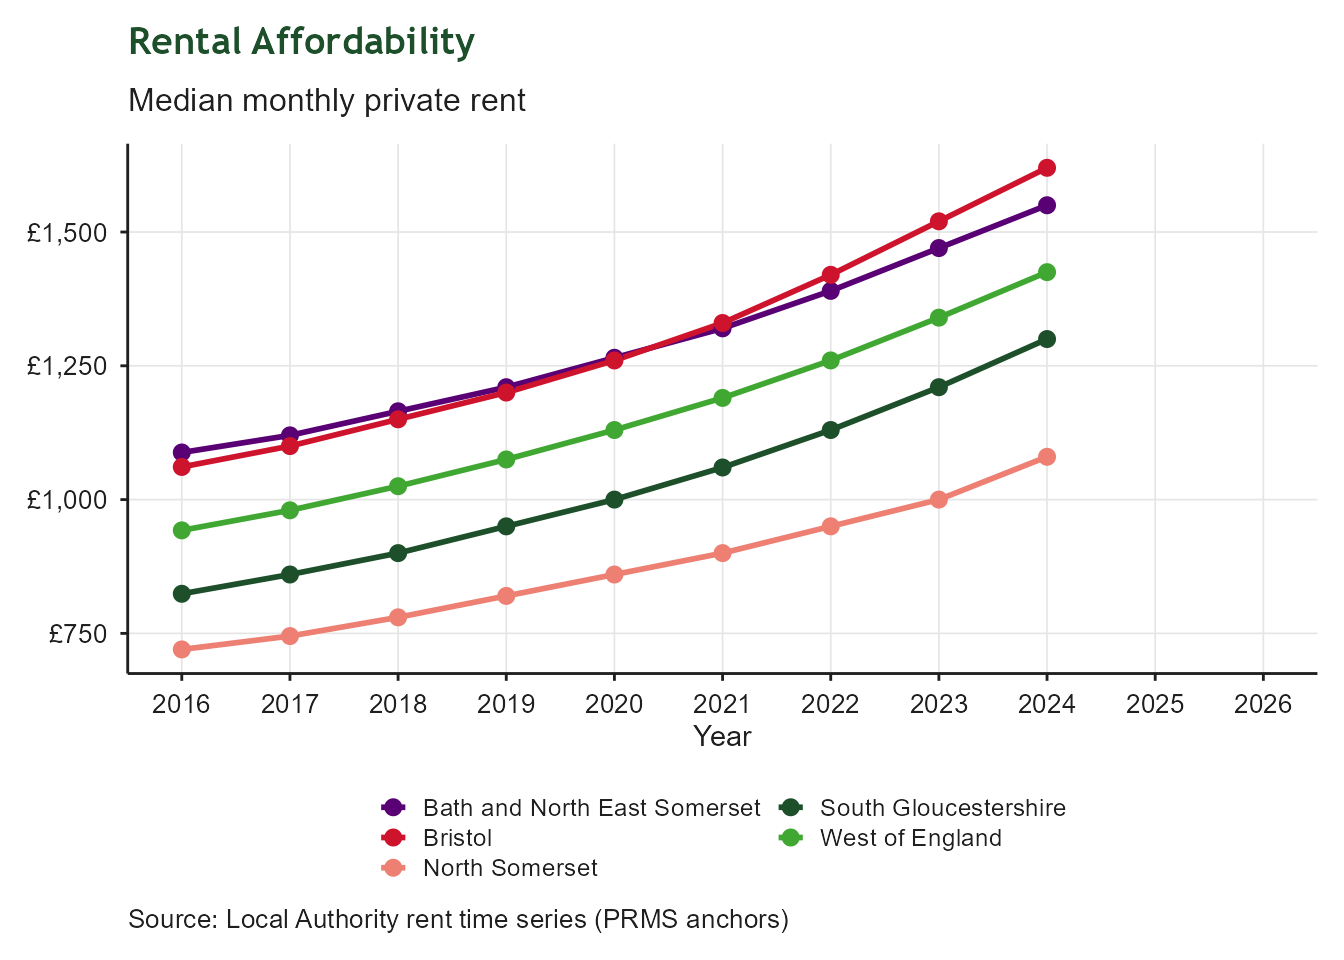
Line chart showing median monthly private rents for each unitary authority and the West of England total. Higher values indicate increased rental costs.

Temporary Accommodation

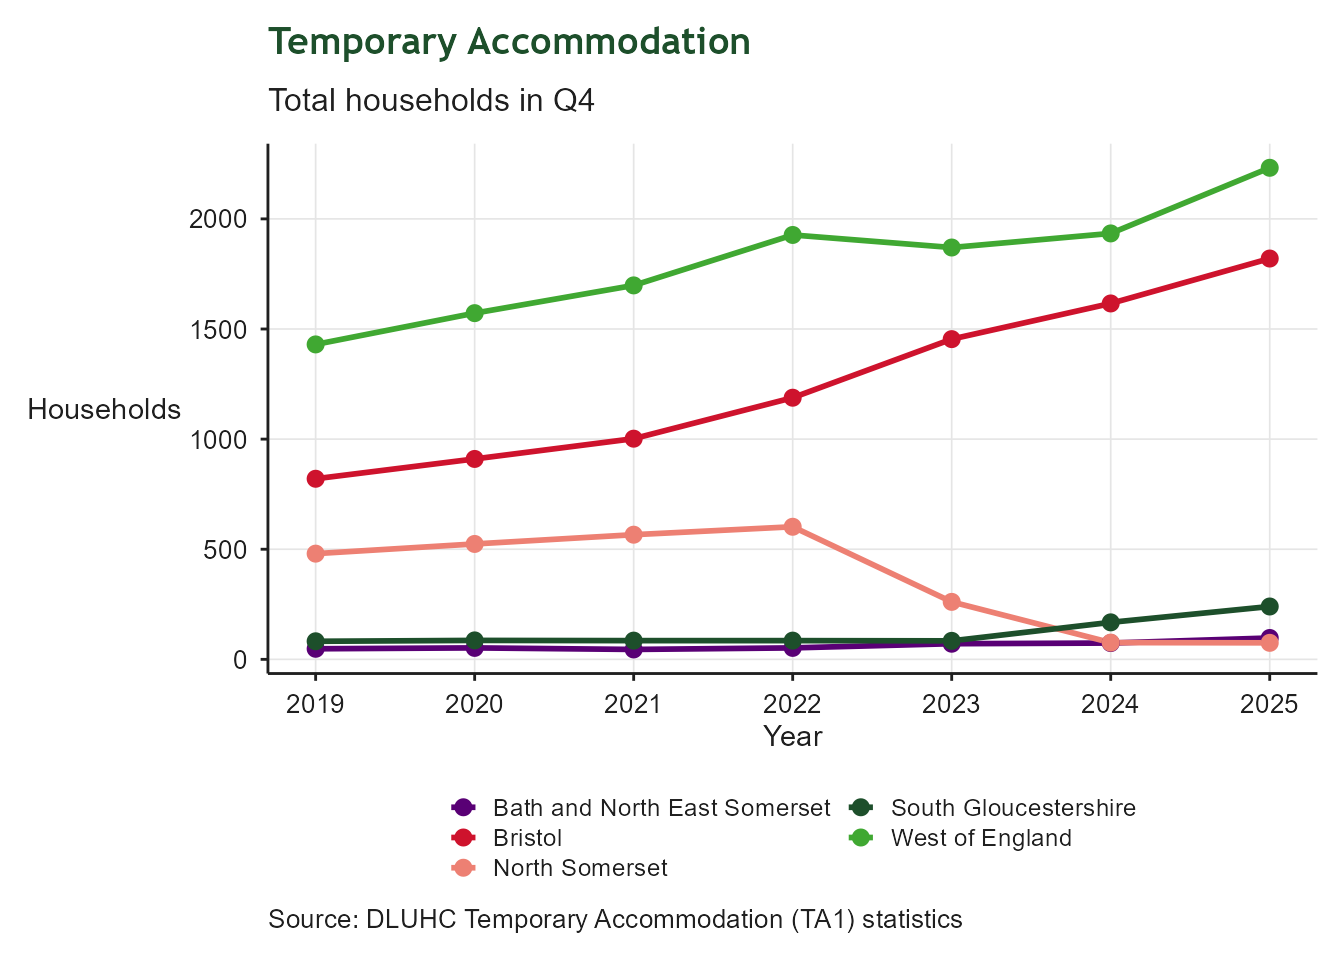
Line chart showing the number of households in temporary accommodation at the Q4 snapshot for each unitary authority and the West of England median, across the full available time series. The y-axis shows household counts; rising lines indicate growing pressure on homelessness services.

Domestic CO₂ Emissions

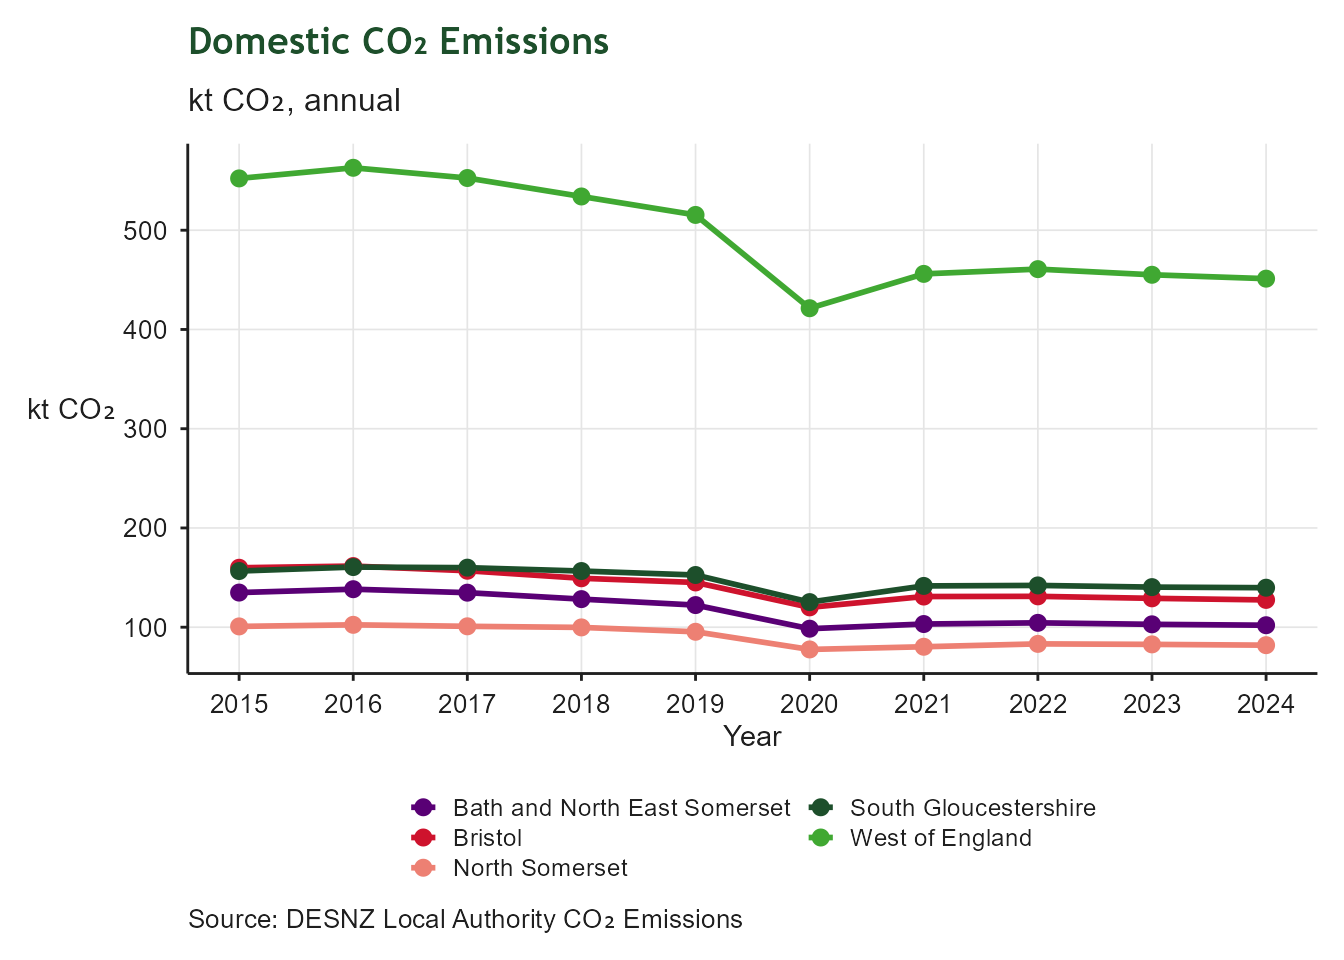
Line chart showing annual domestic CO2 emissions in kilotonnes for each unitary authority and the summed West of England total over the most recent ten years. The y-axis shows kt CO2; falling lines indicate progress towards decarbonising the residential sector.

Future-Ready Skills

Empowering residents with future-ready skills

Residents with No Qualifications

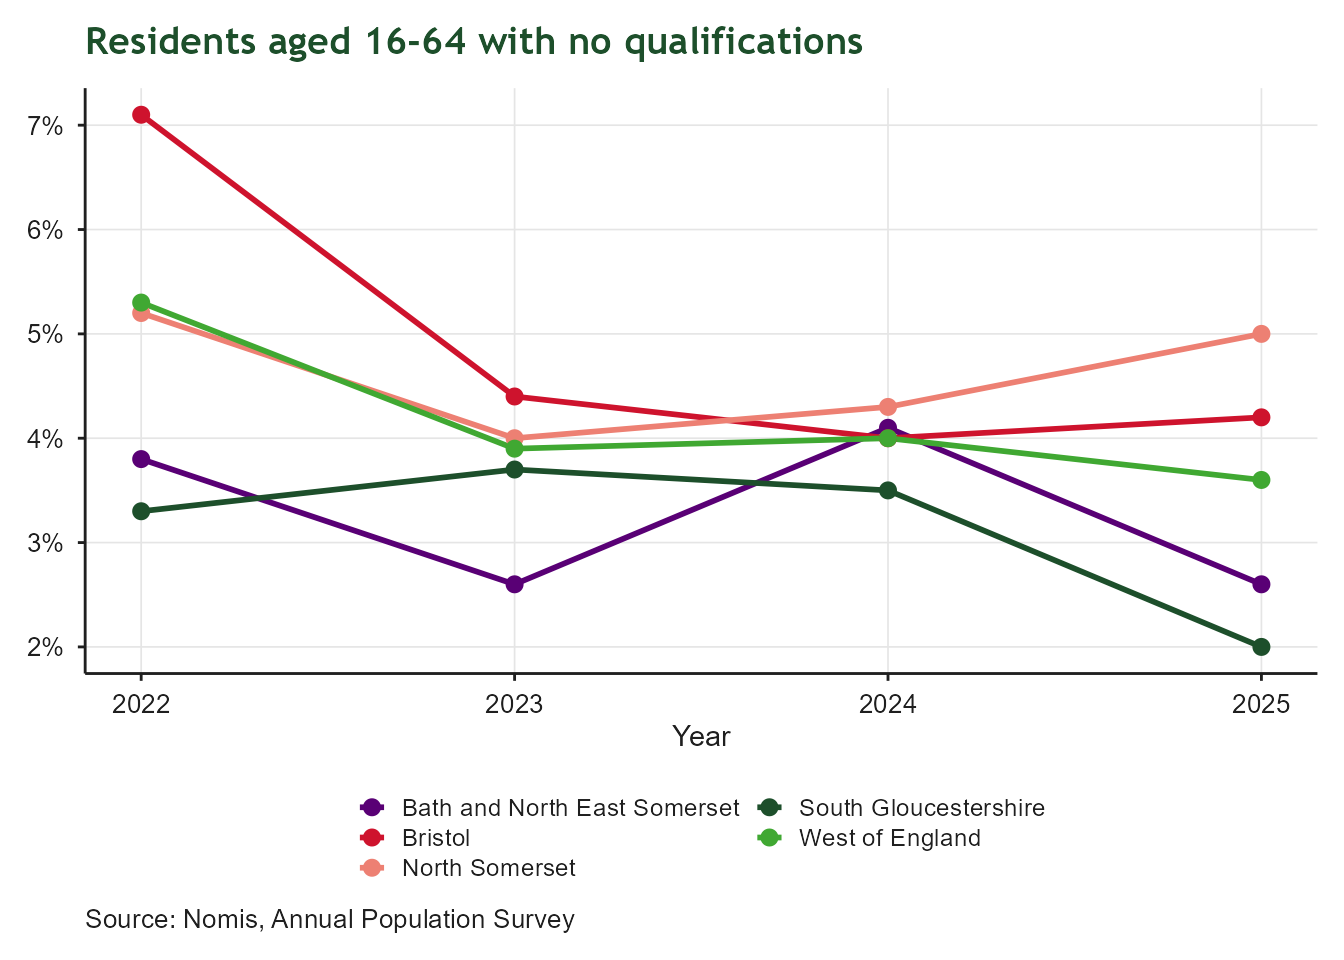
Line chart of the percentage of residents aged 16 to 64 with no qualifications, from December 2022 onwards, for Bath and North East Somerset, Bristol, North Somerset, South Gloucestershire and the West of England as a whole. Lines are broadly flat to declining across the local authorities, with the West of England tracking below most of the individual unitary authorities.

Residents with Level 4+ Qualifications
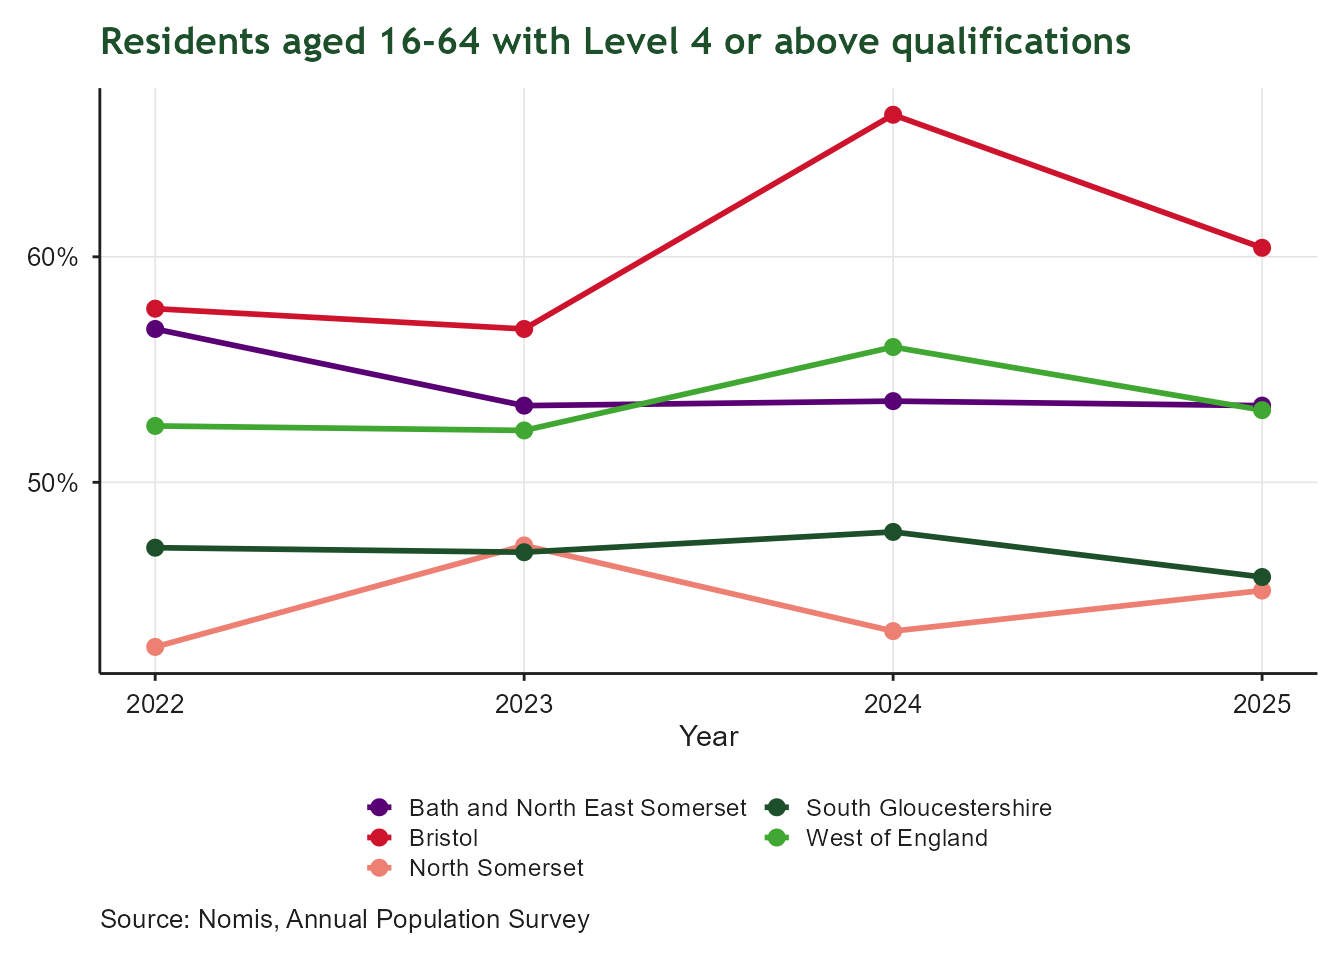
Line chart of the percentage of residents aged 16 to 64 qualified to Level 4 or above, from December 2022 onwards, for Bath and North East Somerset, Bristol, North Somerset, South Gloucestershire and the West of England as a whole. Bath and North East Somerset consistently shows the highest share of higher-level qualifications, while the West of England sits in the middle of the group.

NEET 16-17

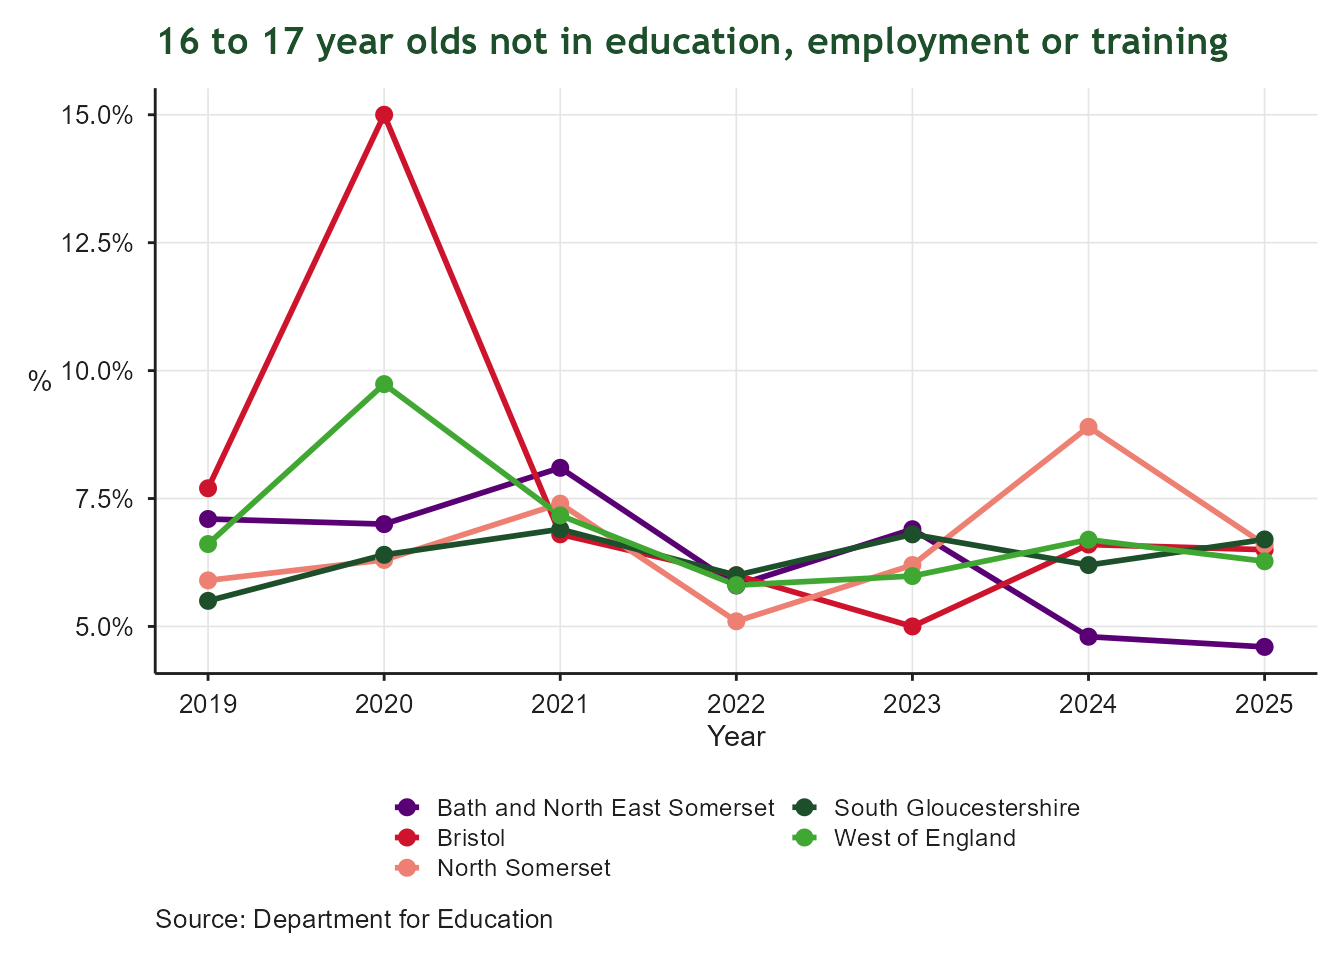
Line chart of the percentage of 16 to 17 year olds not in education, employment or training, by year from 2015 onwards, for Bath and North East Somerset, Bristol, North Somerset, South Gloucestershire and the West of England as a whole. Rates vary between the local authorities year to year, with no single authority consistently highest or lowest.

Below Living Wage

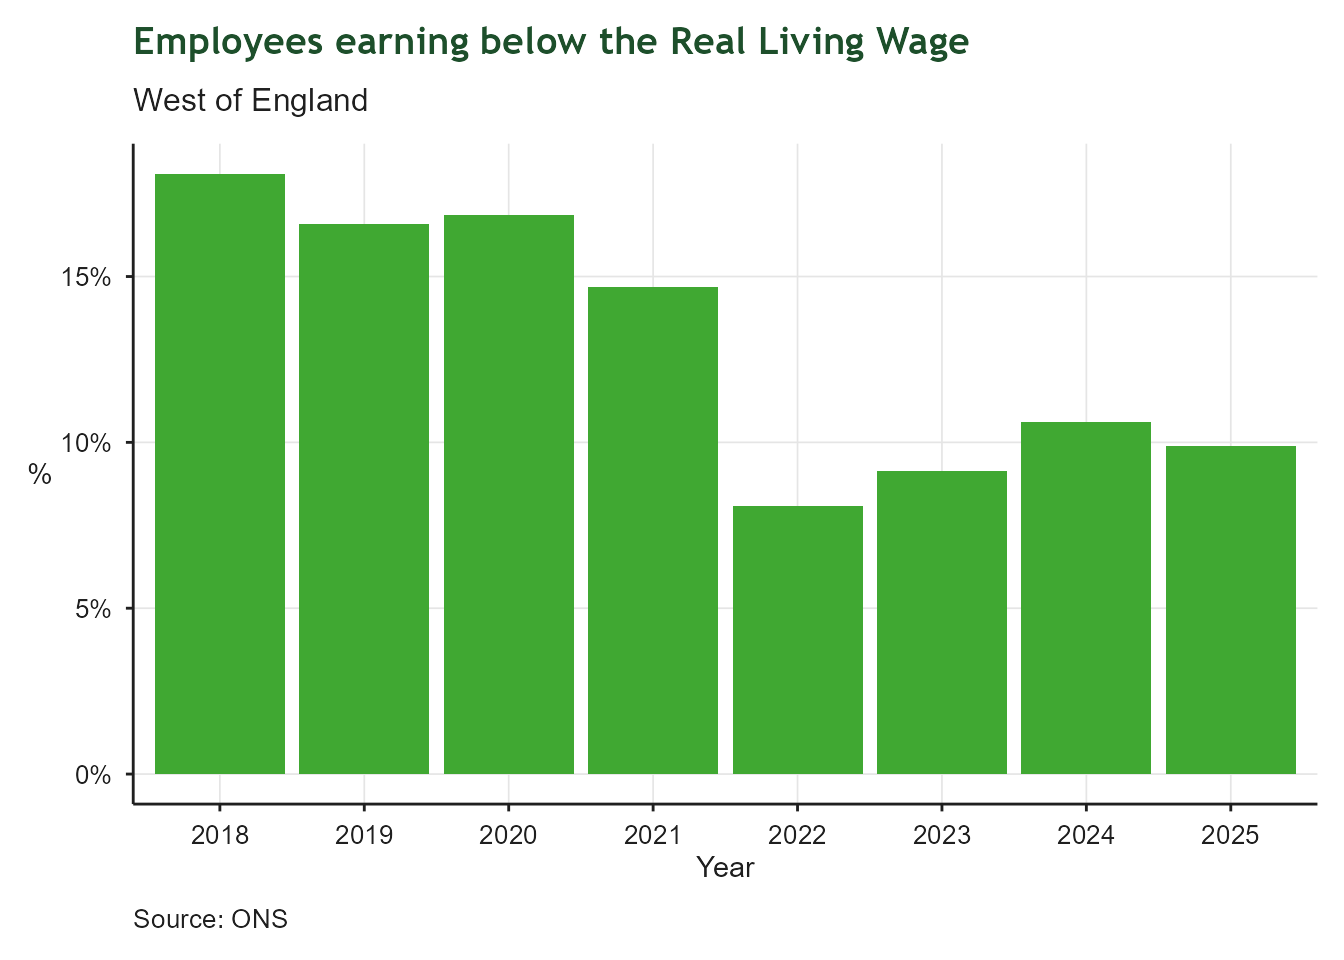
Bar chart of the percentage of employees in the West of England earning below the Real Living Wage, by year from 2015 onwards. The share below the Living Wage has generally declined over the period, though the most recent year is provisional and may be revised.

Economic Inactivity

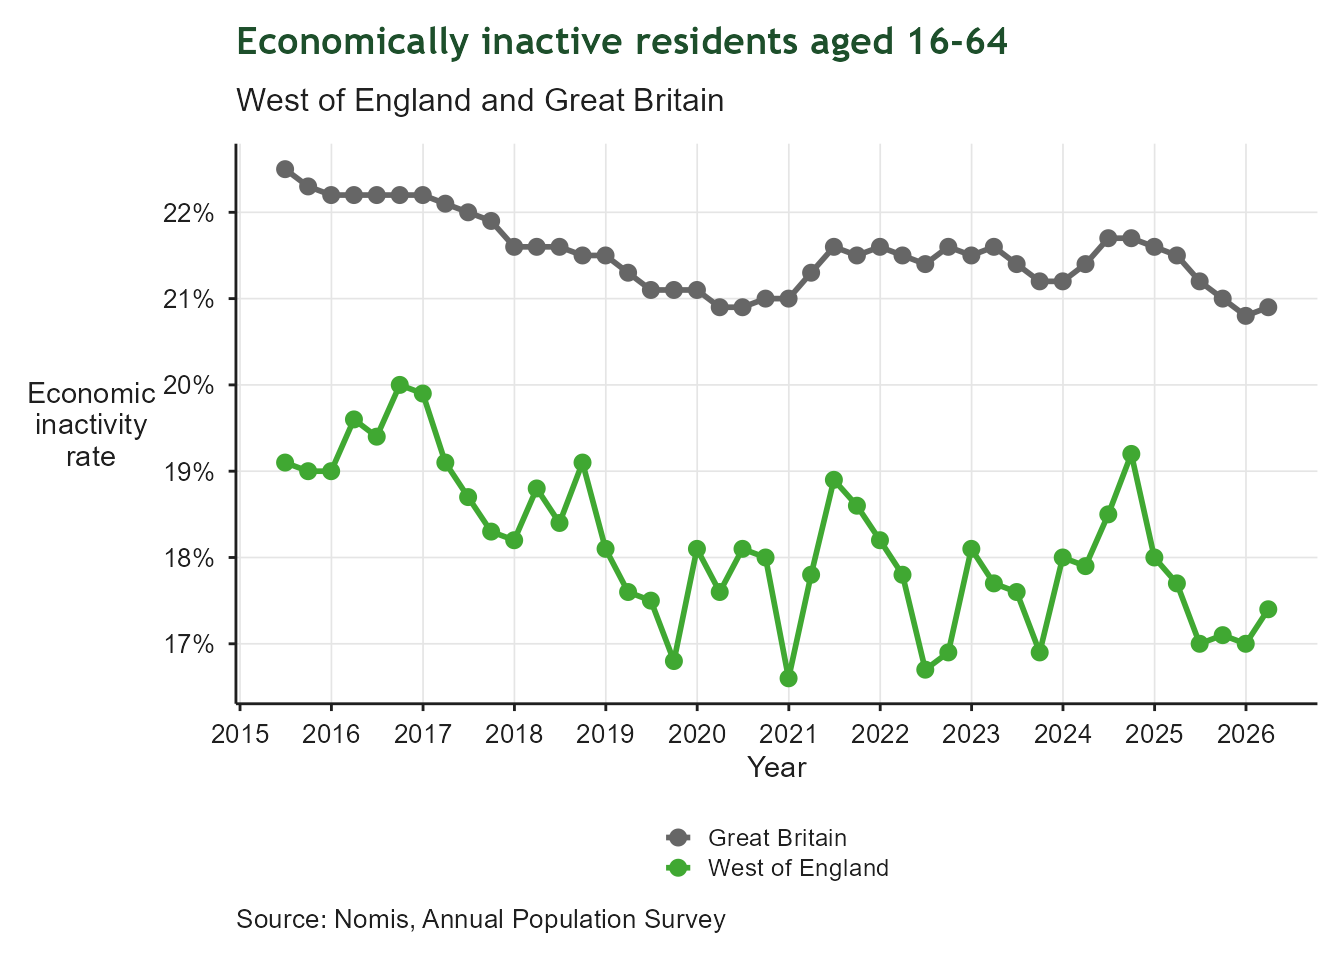
Line chart of the economic inactivity rate for residents aged 16 to 64, tracked monthly over the most recent years, comparing the West of England against Great Britain. The West of England rate tracks below the Great Britain rate for most of the period, with both series showing similar fluctuations over time.

Apprenticeship Starts

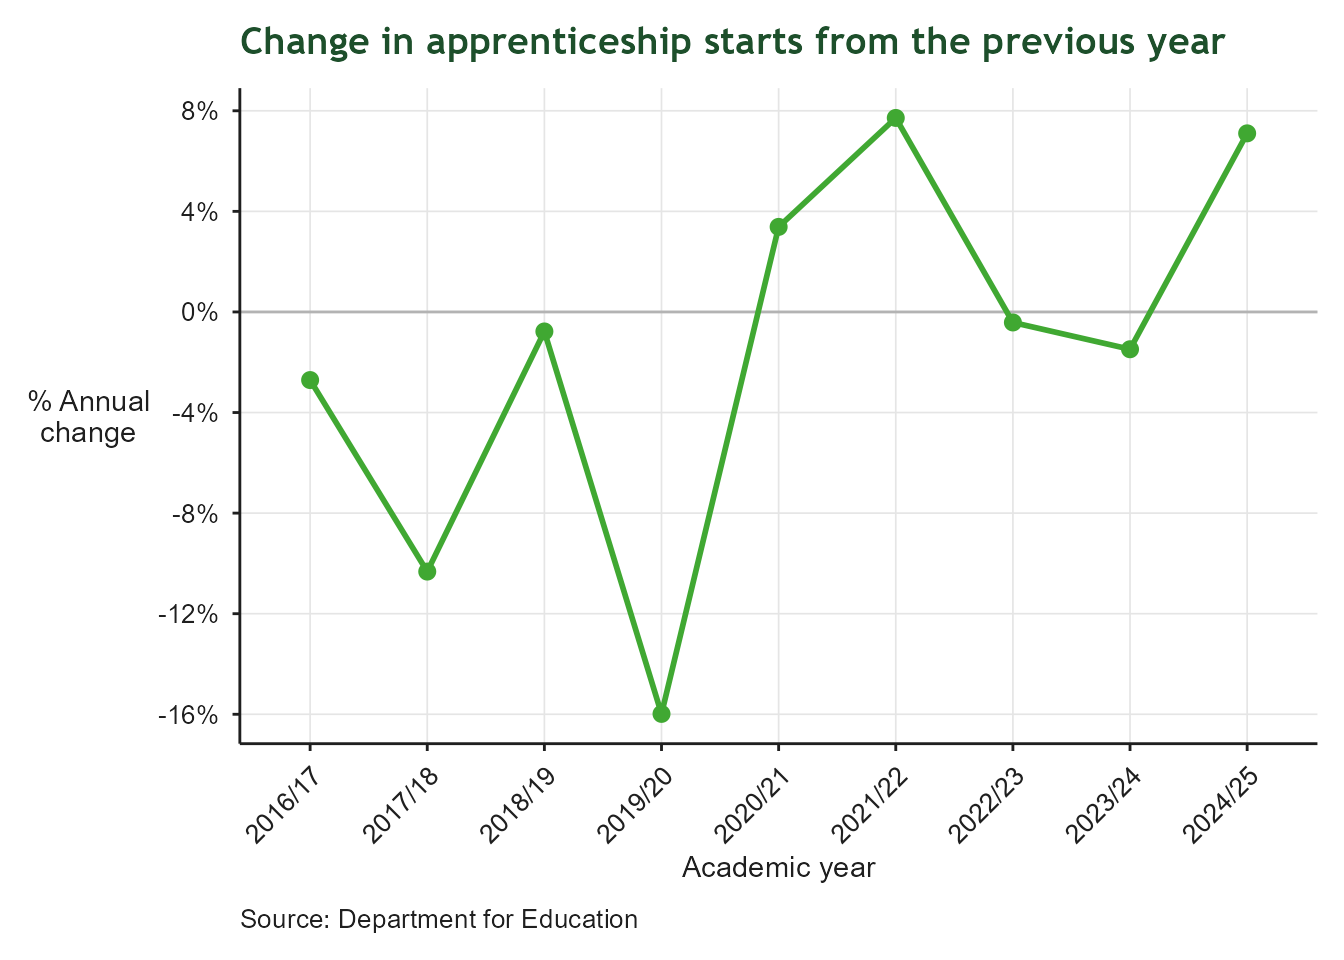
Line chart of the year-on-year percentage change in apprenticeship starts for the West of England, from the 2016/17 academic year onwards, with a reference line at zero. The change fluctuates above and below zero across the years, showing no sustained upward or downward trend in apprenticeship uptake.

Apprenticeship Starts

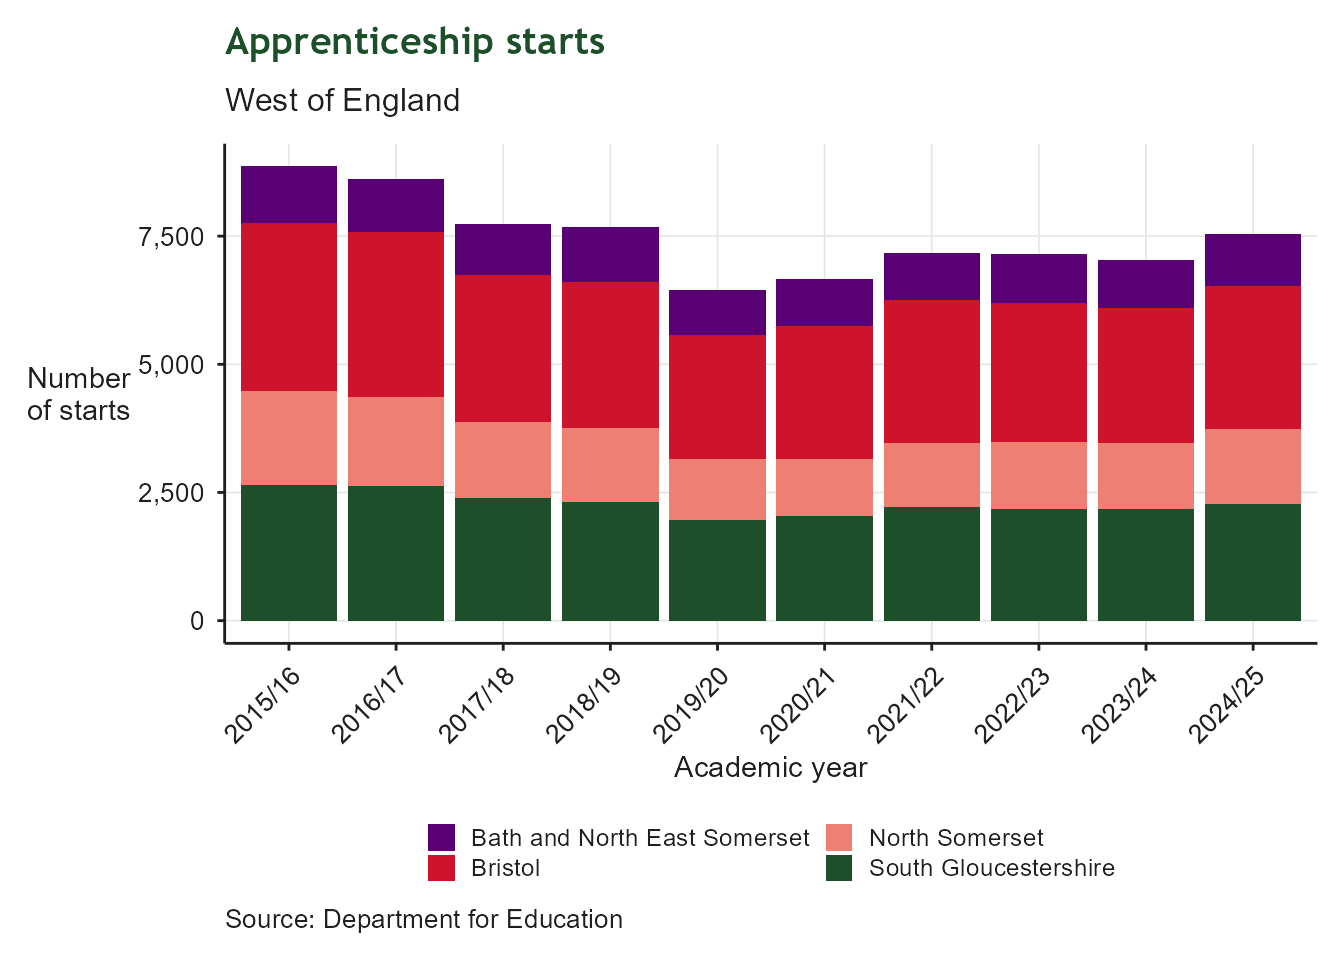
Stacked bar chart of apprenticeship starts by academic year from 2015/16 onwards, with bars split by Bath and North East Somerset, Bristol, North Somerset and South Gloucestershire. Total starts vary year to year, with Bristol consistently contributing the largest share of the regional total.

KS4 Attainment 8

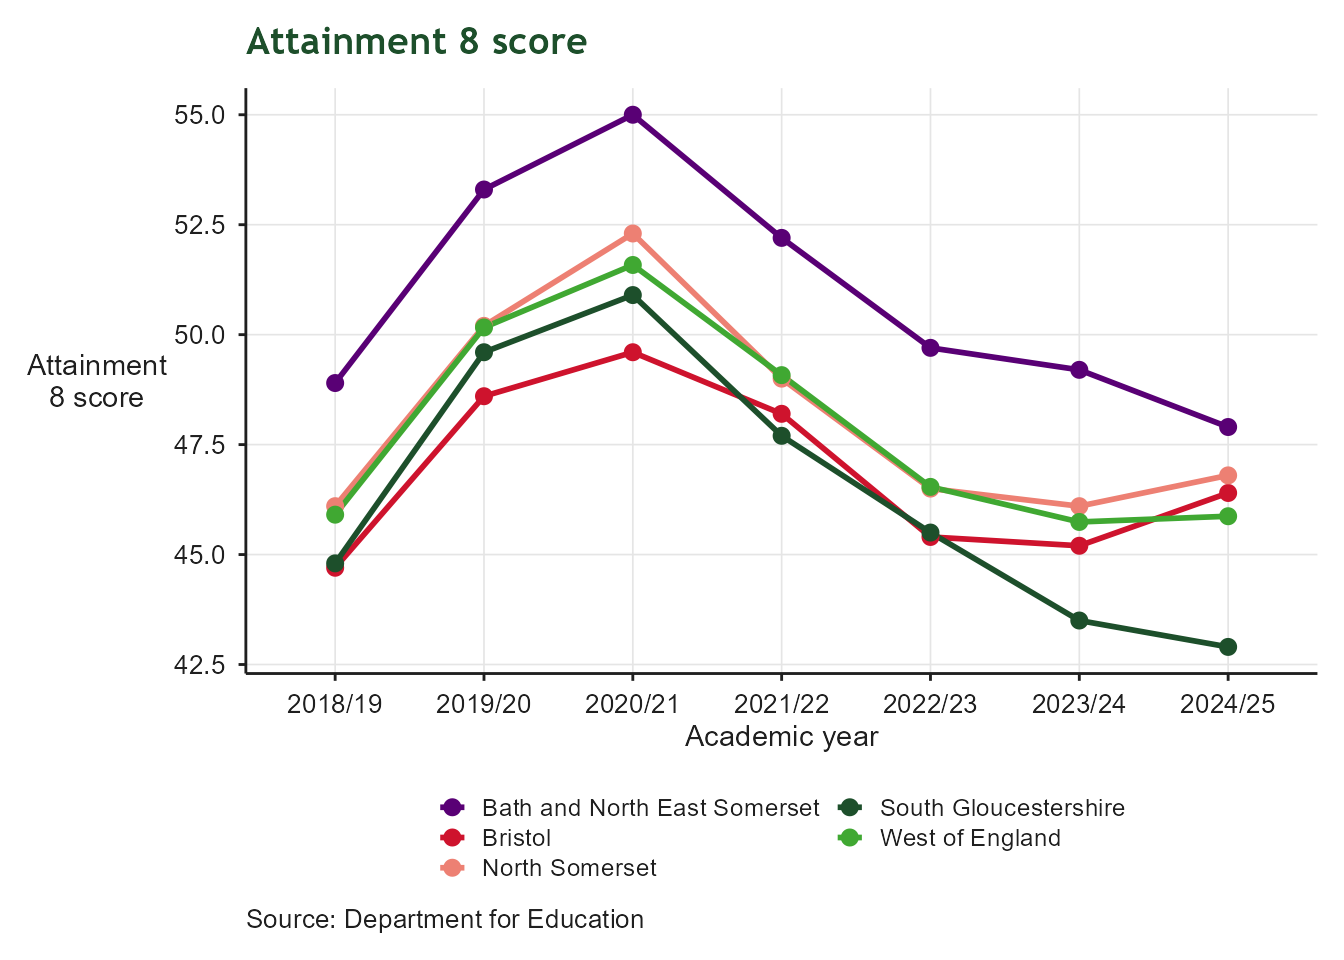
Line chart of average Attainment 8 score by academic year from 2015/16 onwards, for Bath and North East Somerset, Bristol, North Somerset, South Gloucestershire and the West of England as a whole. Scores dip in the years affected by the COVID-19 pandemic before partially recovering, with Bath and North East Somerset generally scoring highest and the West of England in the middle of the group.

Green Jobs and Growth

Making the West of England the home for green jobs and growth

Greenhouse Gas Emissions

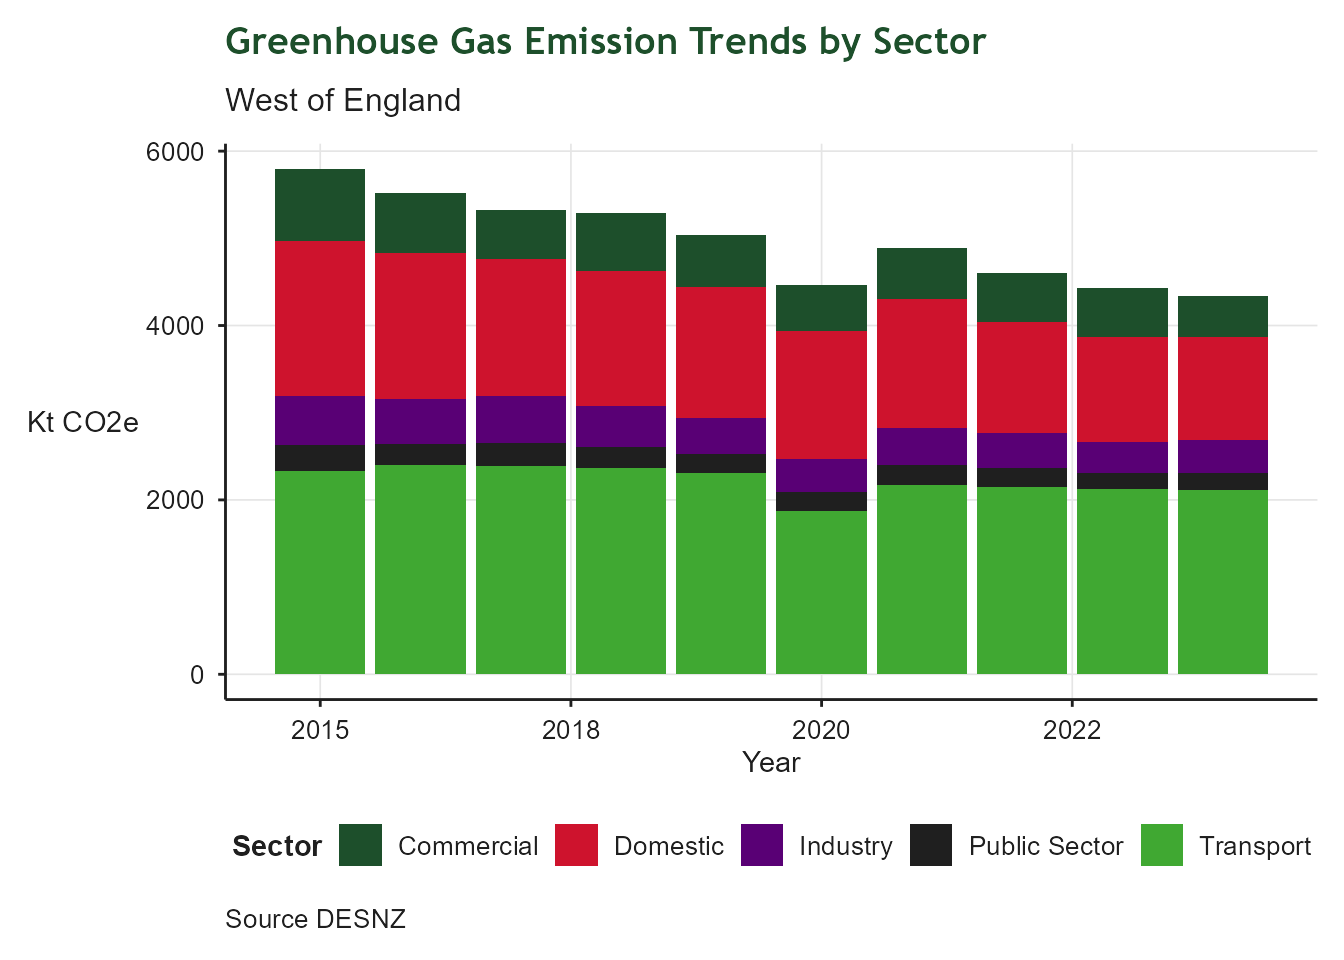
Stacked bar chart of greenhouse gas emissions by sector in the West of England Combined Authority area, 2014 to 2023. The y-axis shows emissions in kilotonnes of CO2 equivalent; the x-axis shows year. Five sectors are colour-coded: Transport (green, largest), Domestic (red), Commercial (dark green), Industry (purple), and Public Sector (black). Total emissions declined from around 6,000 kt CO2e in 2014 to approximately 4,400 kt CO2e in 2023, though the region is not on track to meet its 2030 net zero target. Transport and domestic heating remain the dominant sectors.

Greenhouse Gas Emissions

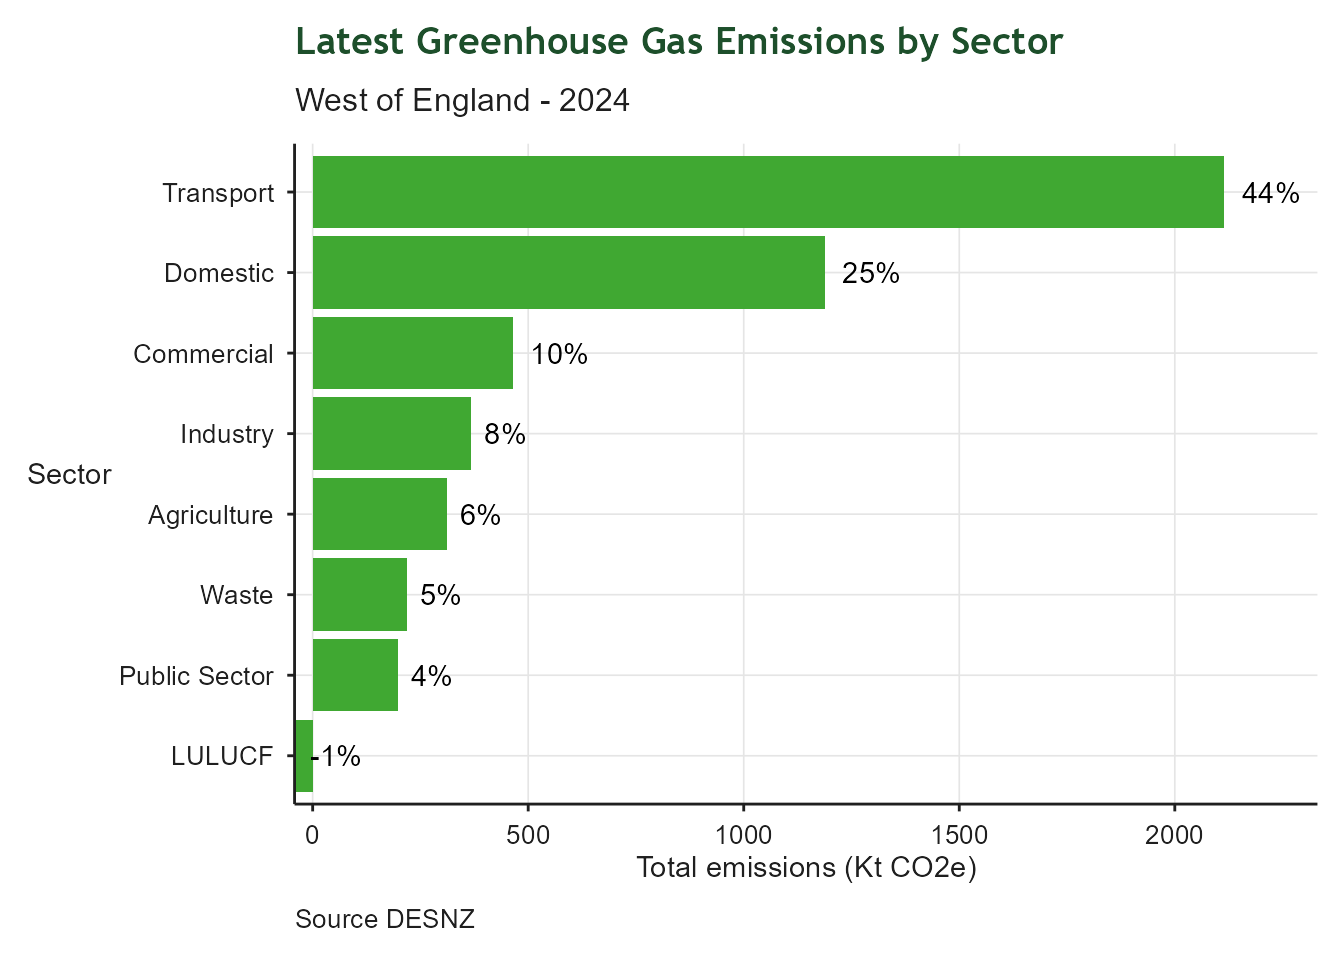
Bar chart showing the percentage contribution of each sector to total greenhouse gas emissions in the West of England Combined Authority area for the latest year - typically 2 years behind the current year. The y-axis shows sector; the x-axis shows emissions in KT CO2e. The chart shows that Transport is the largest contributor followed by Domestic

Heat Associated Mortality

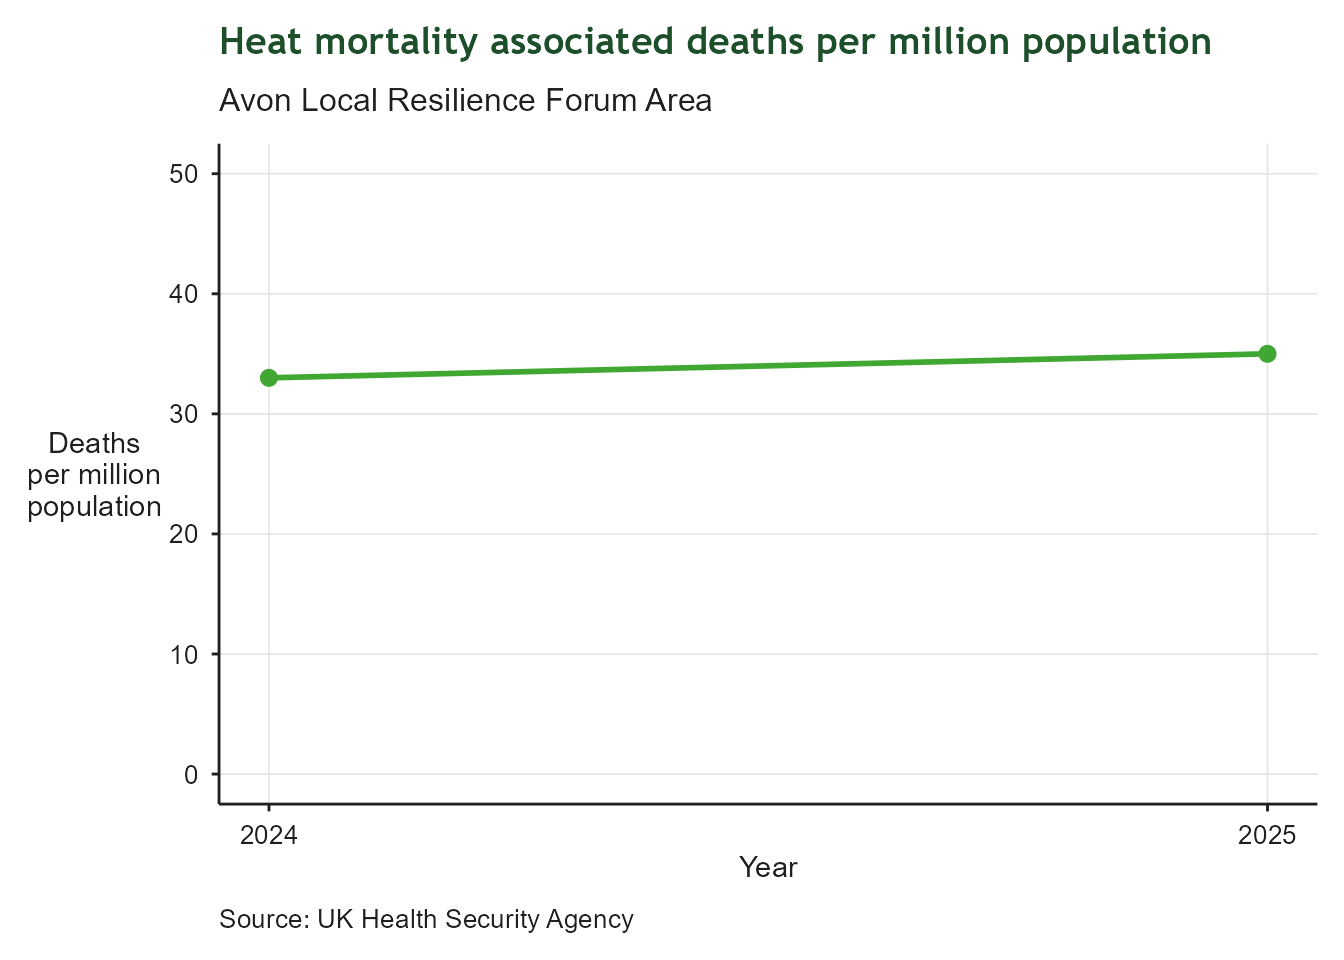
Line and point chart showing heat-associated mortality in the Avon Local Resilience Forum area for 2024 and 2025. The y-axis shows deaths per million population on a scale from 0 to 50; the x-axis shows year. Two data points are shown: approximately 33 deaths per million in 2024 rising to around 35 in 2025. The small increase is consistent with the continuing rise in temperatures from a warming climate.

Flood Warnings Intensity

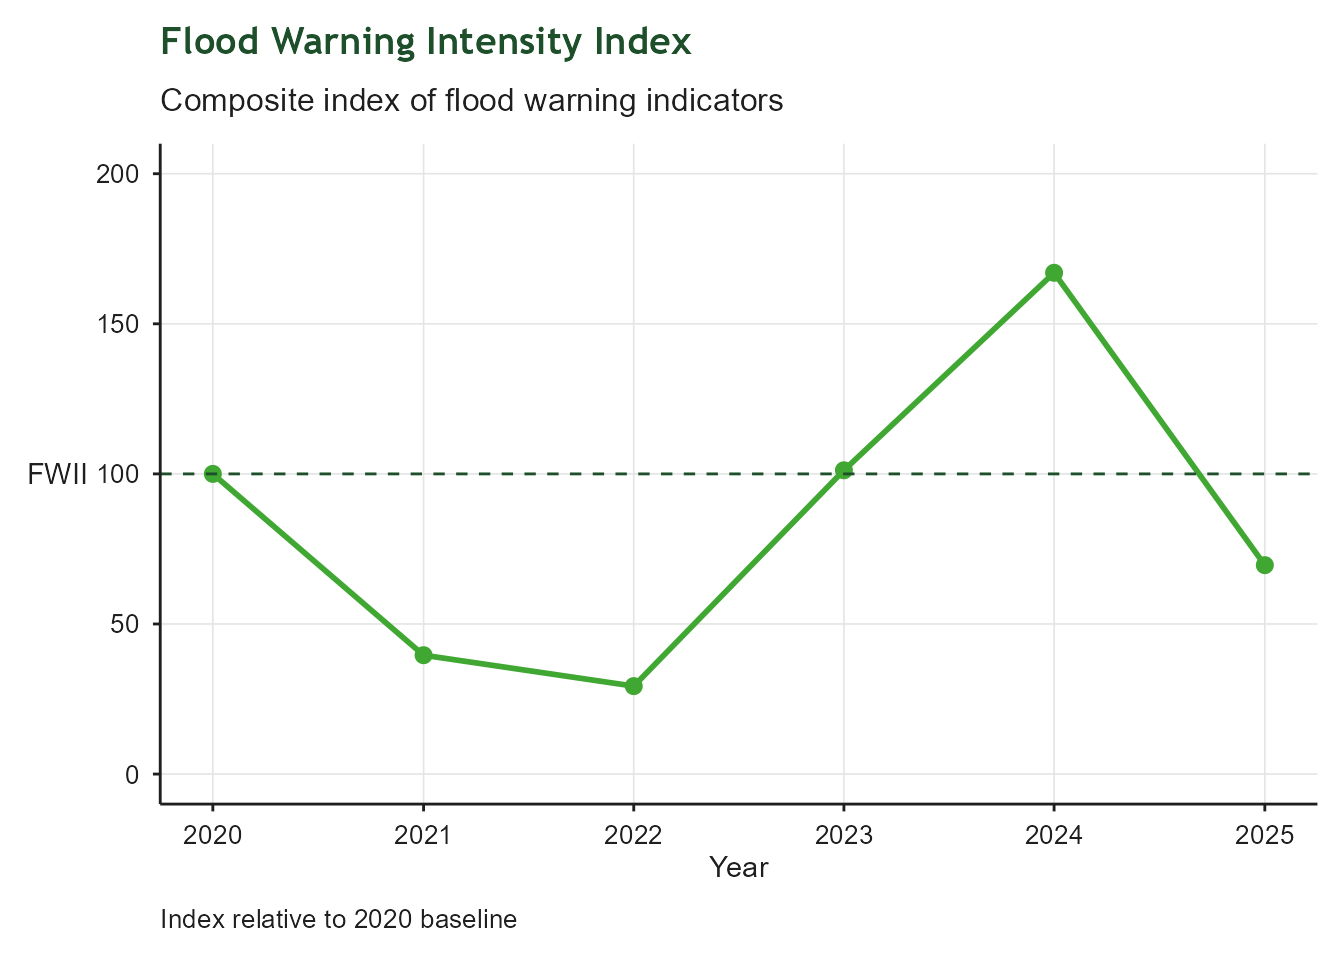
Line and point chart of the Flood Warning Intensity Index (FWII) for the West of England from 2020 to 2025. The y-axis shows the composite index value on a scale from 0 to 200; the x-axis shows year. A dashed green horizontal line marks the 2020 baseline at 100. The index fell sharply to around 40 in 2021 and 30 in 2022, returned to the baseline in 2023, peaked at approximately 165 in 2024, then dropped below the baseline to around 70 in 2025. The 2024 peak represents the highest flood warning intensity in the series.

Water Catchment Health

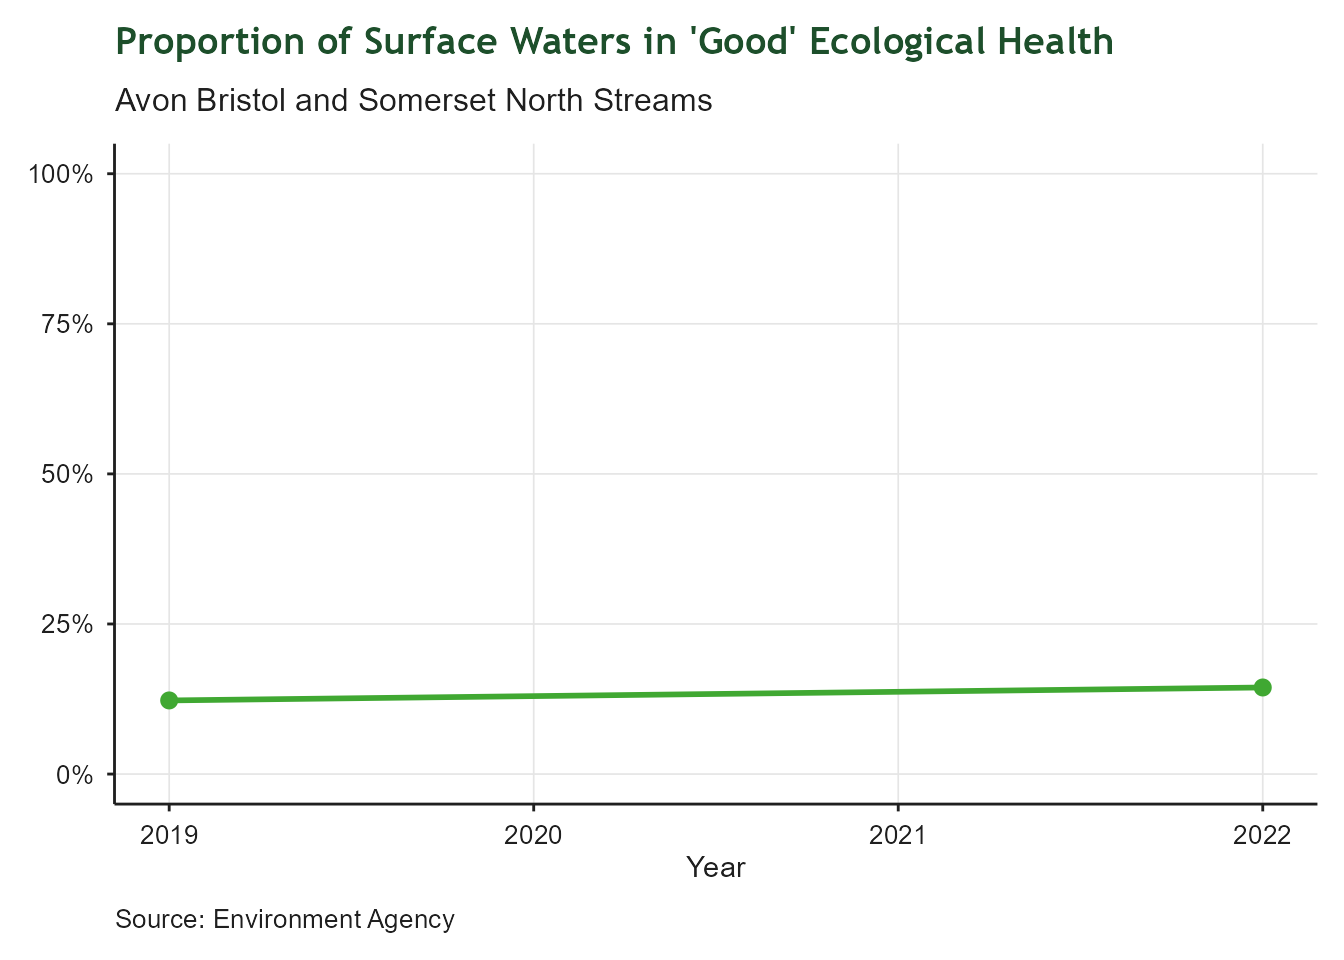
Line and point chart of the proportion of surface waters in 'Good' ecological health in the Avon Bristol and Somerset North Streams catchment, for 2019 and 2022. The y-axis shows percentage from 0% to 100%; the x-axis shows year. Both data points sit at approximately 14-15%, showing virtually no change and reflecting the national picture of persistently poor surface water quality.

Tree Canopy

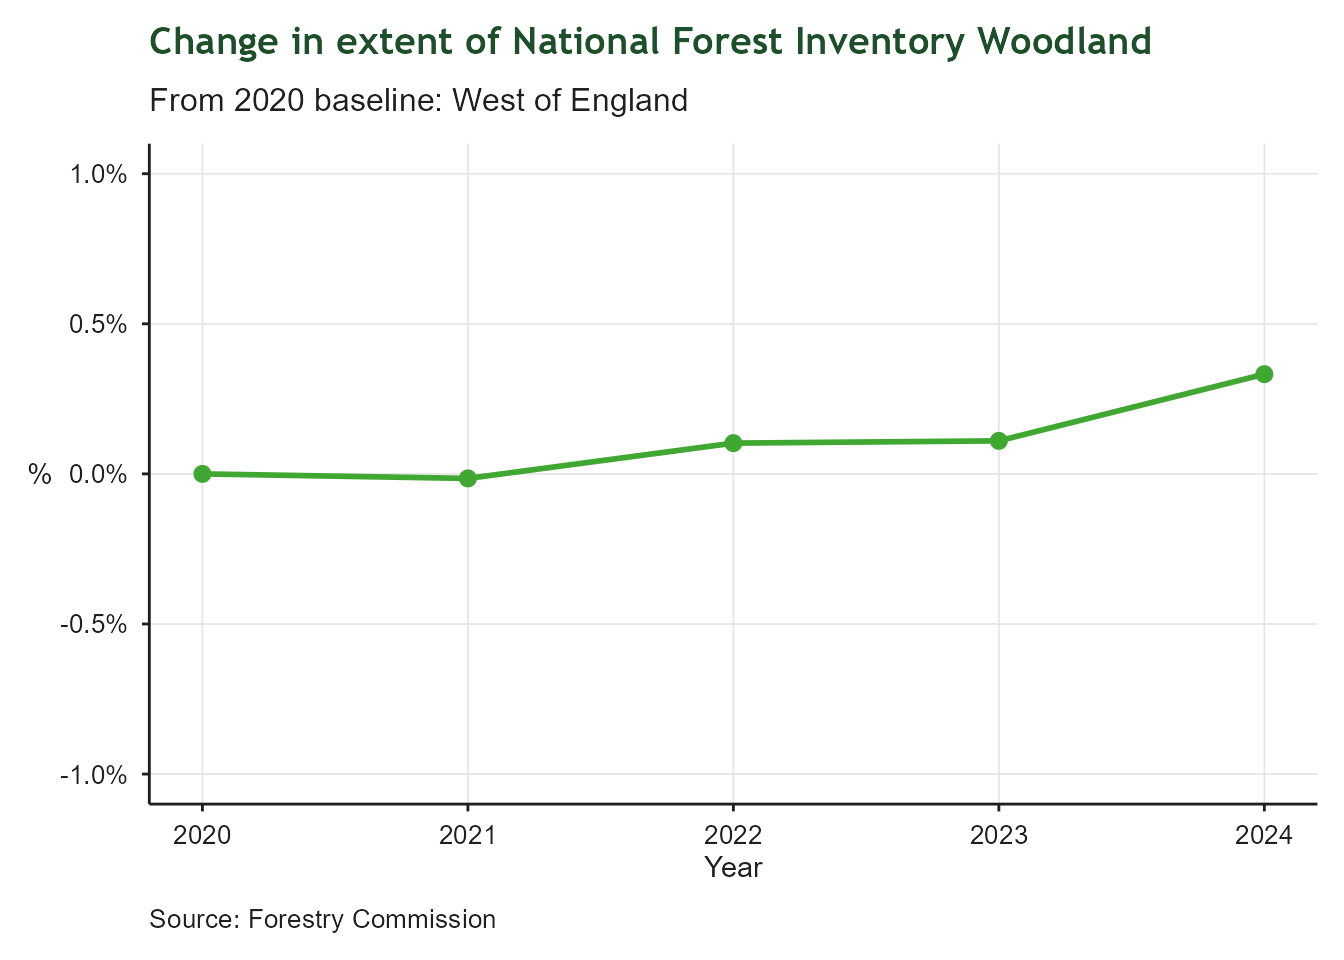
Line chart showing the percentage change in National Forest Inventory woodland extent in the West of England from the 2020 baseline, covering 2020 to 2024. The y-axis shows percentage change on a scale from -1% to +1%; the x-axis shows year. The line remains very close to zero throughout, ending at approximately +0.3% by 2024, indicating a small but positive increase in woodland cover since 2020.

Non-Domestic Energy Performance

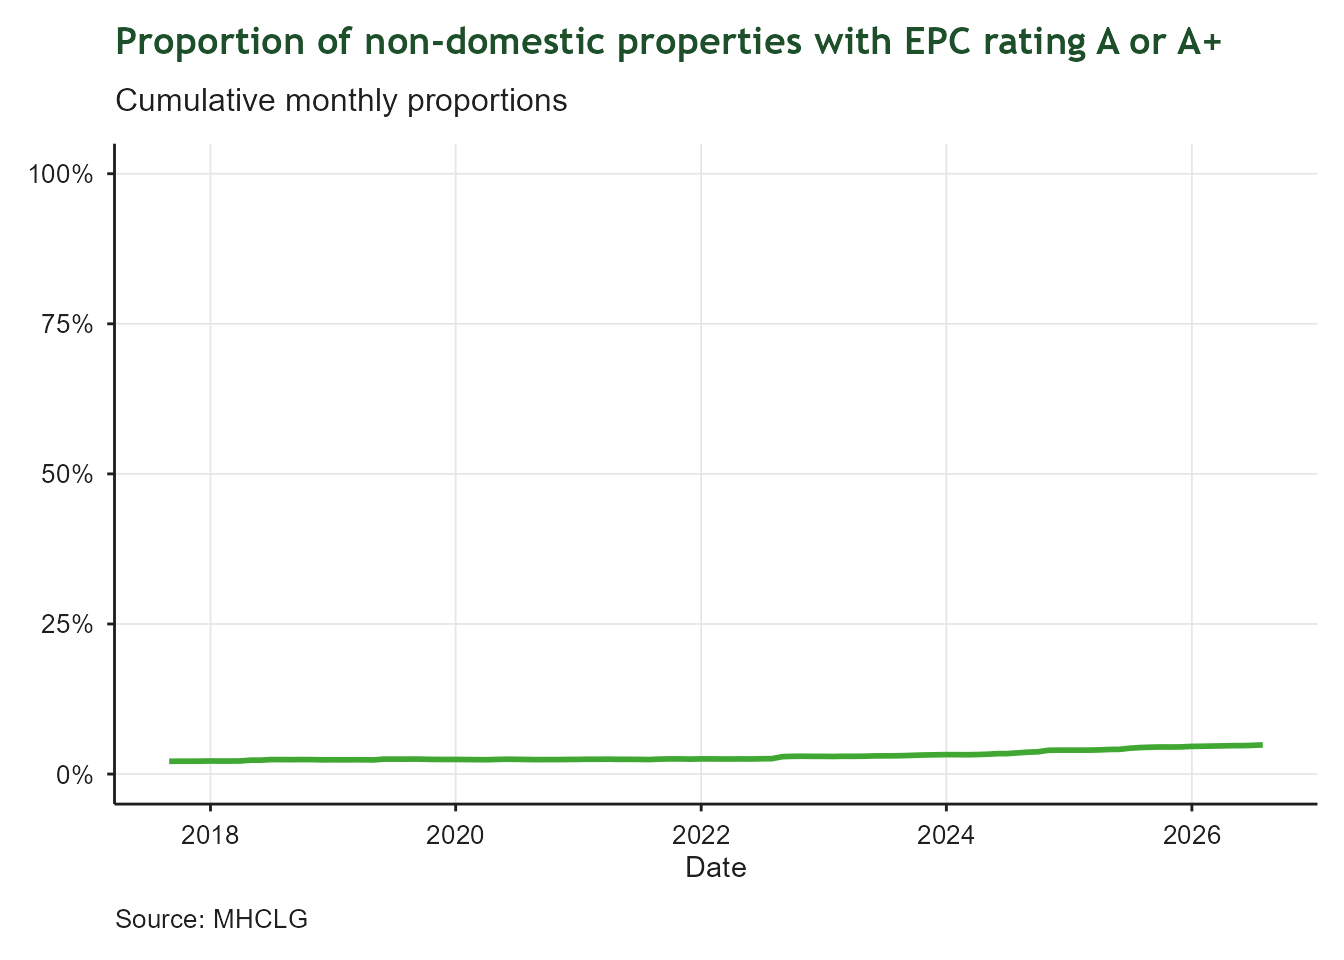
Line chart showing the cumulative monthly proportion of non-domestic properties in the West of England with an EPC energy rating of A or A+, from 2017 to 2026. The y-axis shows percentage from 0% to 100%; the x-axis shows date. The line rises very gradually from under 2% to approximately 6% by 2026, showing slow but steady improvement in the proportion of best-performing non-domestic buildings.

Domestic Renewable Energy

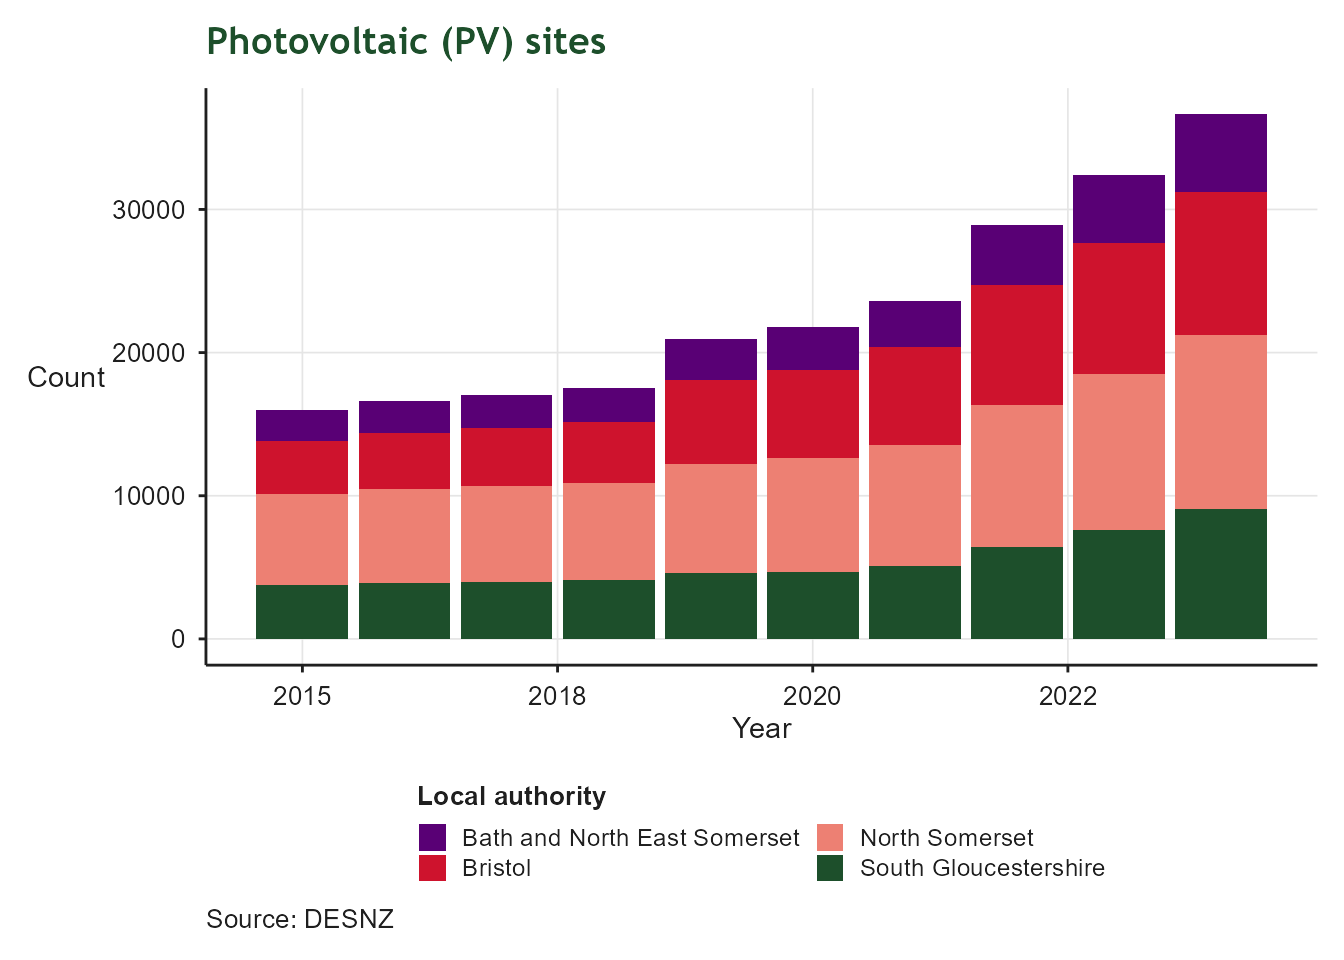
Stacked bar chart of photovoltaic (PV) site counts by local authority in the West of England, from 2015 to 2024. The y-axis shows the number of sites; the x-axis shows year. North Somerset (black) has the largest share, followed by Bristol (red), Bath and North East Somerset (purple), and South Gloucestershire (dark green). Total PV sites increased steadily from around 16,000 in 2015 to over 36,000 in 2024, indicating consistent growth in domestic solar adoption.

Renewable Energy

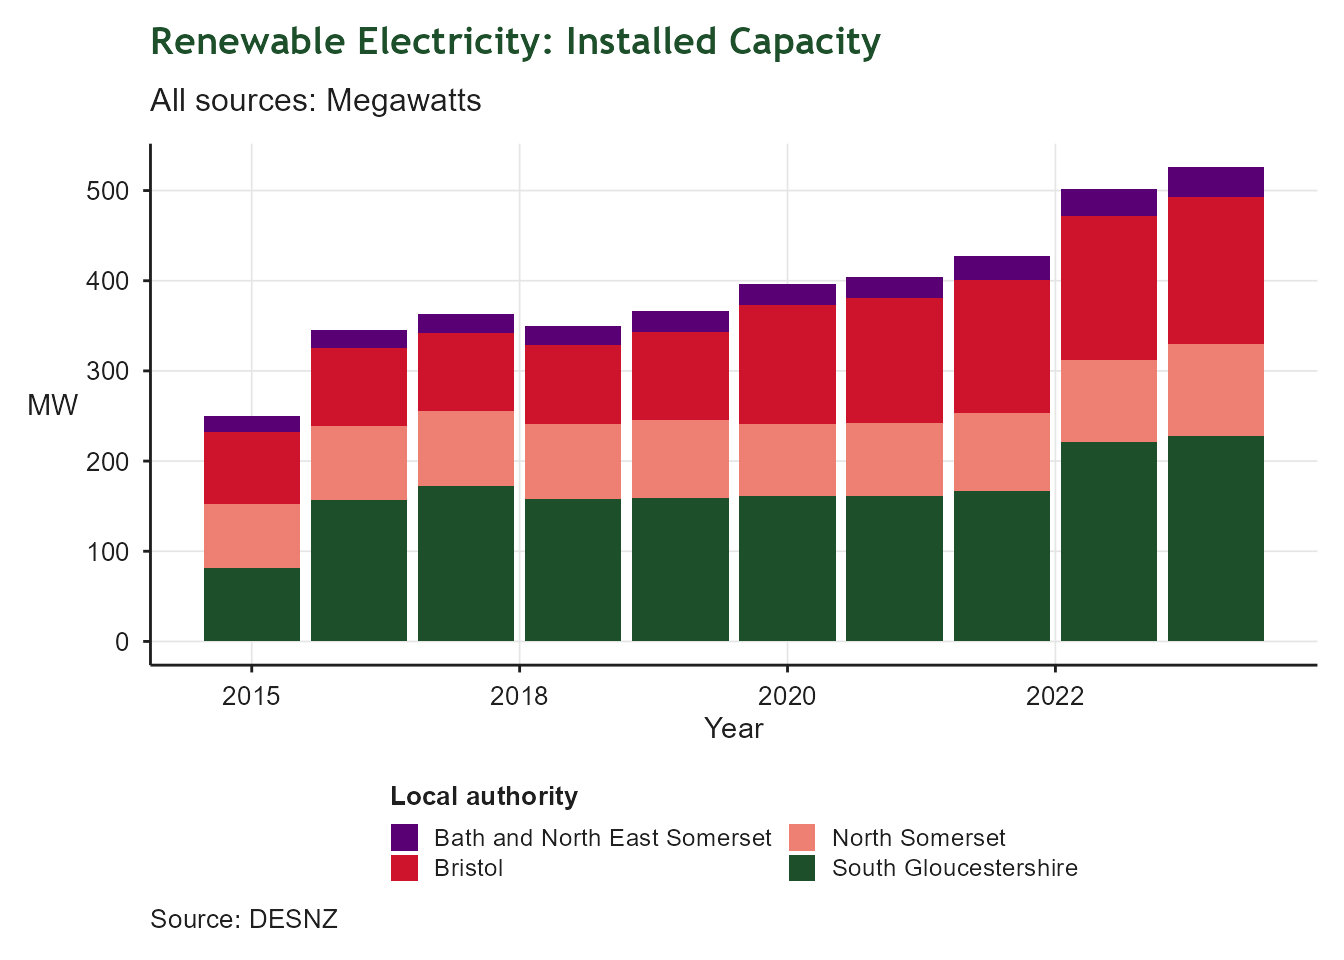
Stacked bar chart of renewable electricity installed capacity in Megawatts by local authority in the West of England, from 2015 to 2024. The y-axis shows capacity in MW; the x-axis shows year. South Gloucestershire (dark green) contributes the largest share, followed by North Somerset (black), Bristol (red), and Bath and North East Somerset (purple). Total installed capacity grew steadily from around 250 MW in 2015 to over 525 MW in 2024, reflecting the region's ambitions for net zero.

Child Poverty

Lifting children and families out of poverty in the West of England

Child Poverty

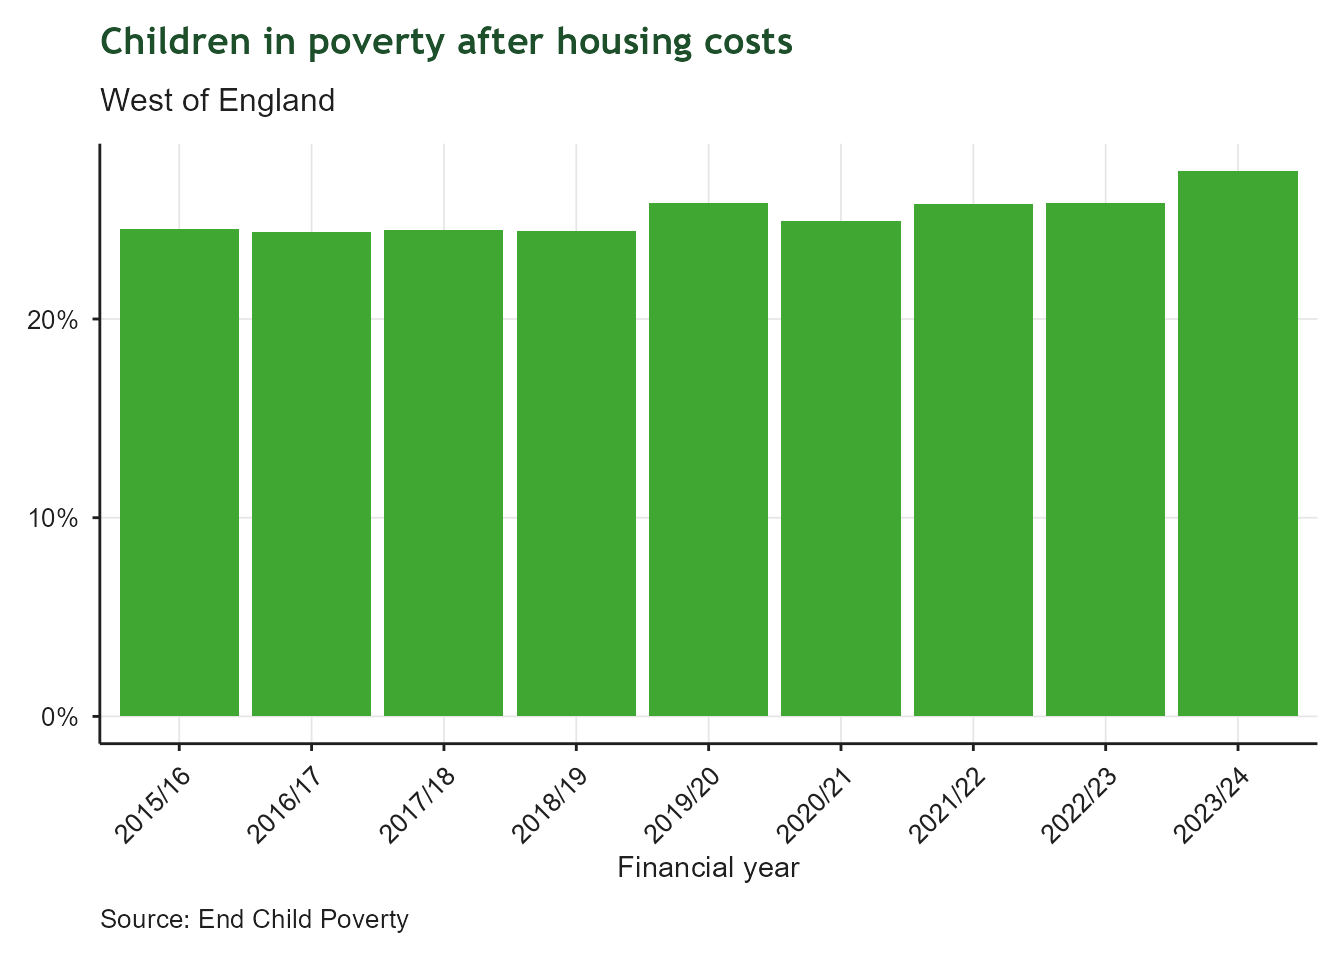
Bar chart of the proportion of children living in low-income households after housing costs in the West of England, financial year 2015/16 to 2023/24. The x-axis shows financial year; the y-axis shows percentage of children in poverty. The rate held broadly steady between 24% and 26% for most of the period before rising to almost 27.5% in 2023/24, the highest level in the series.

Children Achieving a Good Level of Development
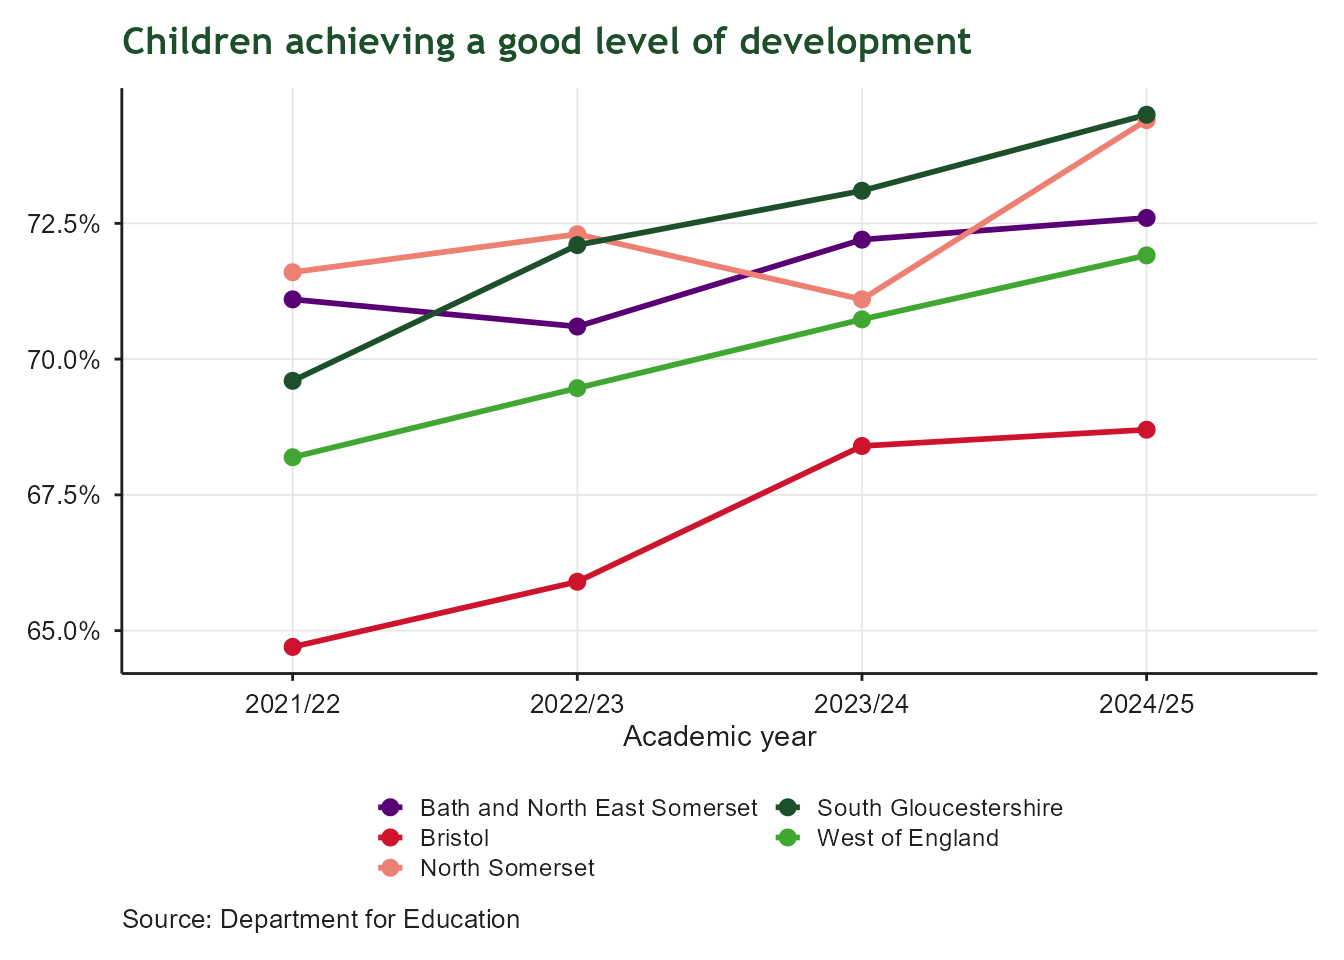
Line chart comparing the percentage of children achieving a good level of development by age five across Bath and North East Somerset, Bristol, North Somerset, South Gloucestershire and the West of England, from 2015/16 onward. The x-axis shows academic year; the y-axis shows percentage, with each local authority shown in a different colour. The West of England average has improved in recent years, rising from around 68% in 2021/22 to almost 72% in 2024/25, with local authorities following a similar upward pattern.

KS2 Expected Standards

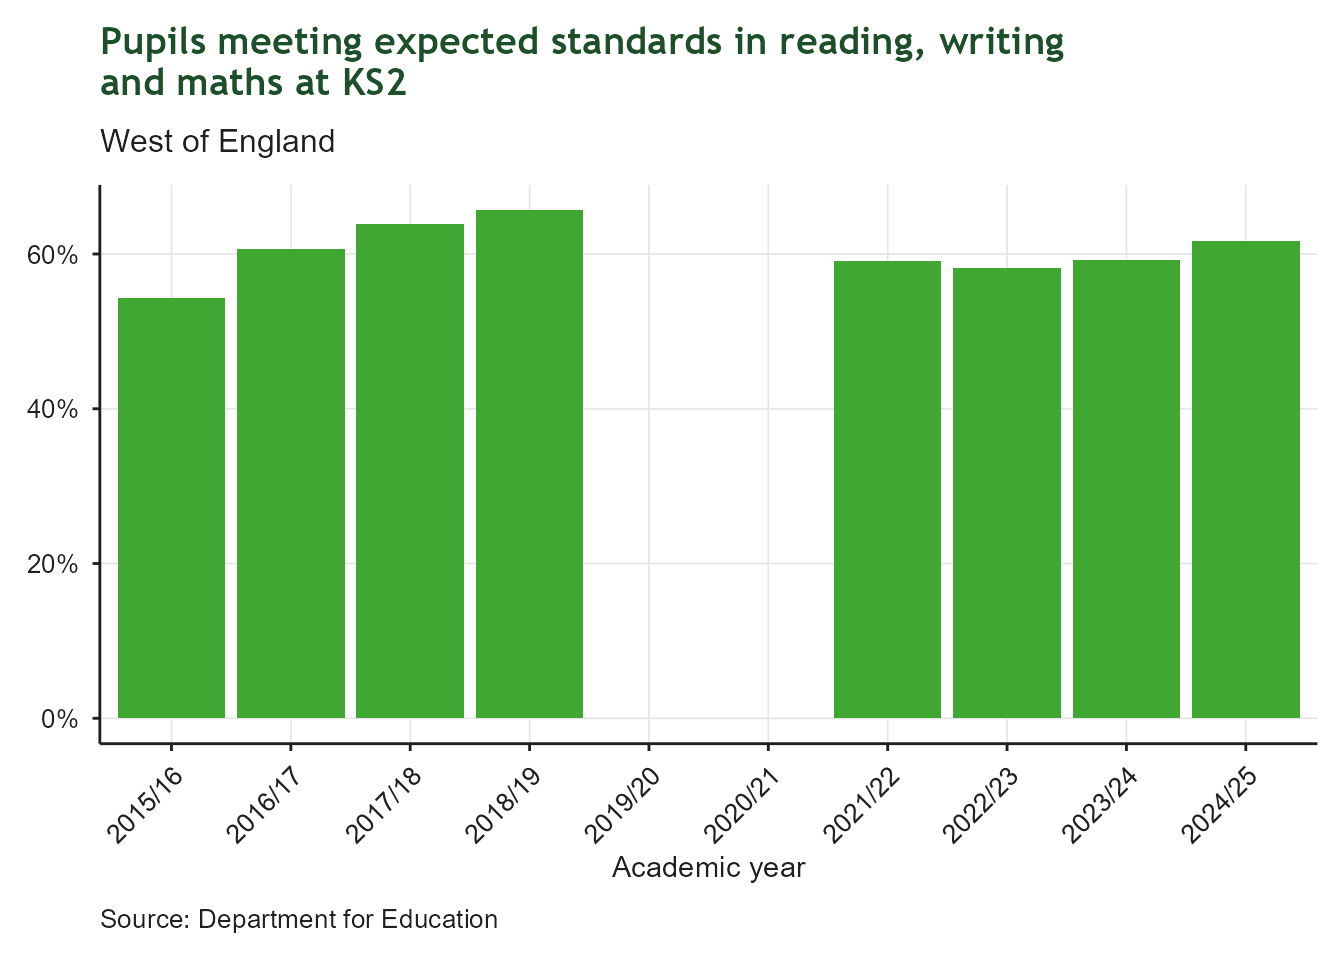
Bar chart of the proportion of pupils meeting expected standards in reading, writing and maths at Key Stage 2 in the West of England, academic year 2015/16 to 2024/25. The x-axis shows academic year; the y-axis shows percentage. Attainment rose from around 54% in 2015/16 to a peak of nearly 66% in 2018/19, then no data is shown for 2019/20 and 2020/21 because assessments were cancelled during the pandemic, before recovering to around 62% by 2024/25.

Free School Meals Eligibility

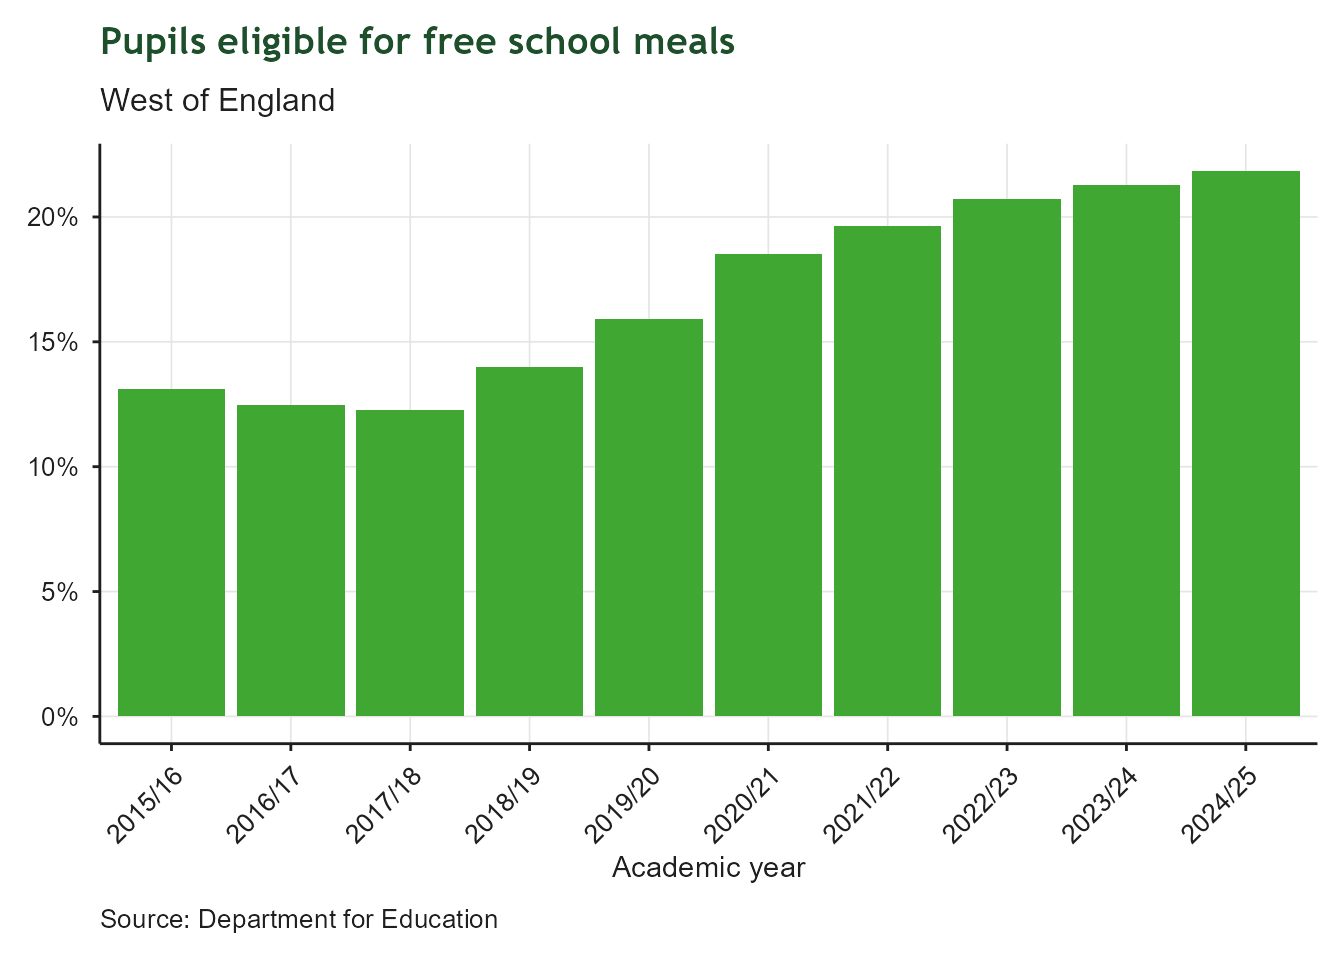
Bar chart of the proportion of pupils eligible for free school meals in the West of England, academic year 2015/16 to 2024/25. The x-axis shows academic year; the y-axis shows percentage. Eligibility has climbed steadily and continuously, from around 13% in 2015/16 to nearly 22% in 2024/25, indicating a growing proportion of families experiencing financial hardship.

Childcare Places

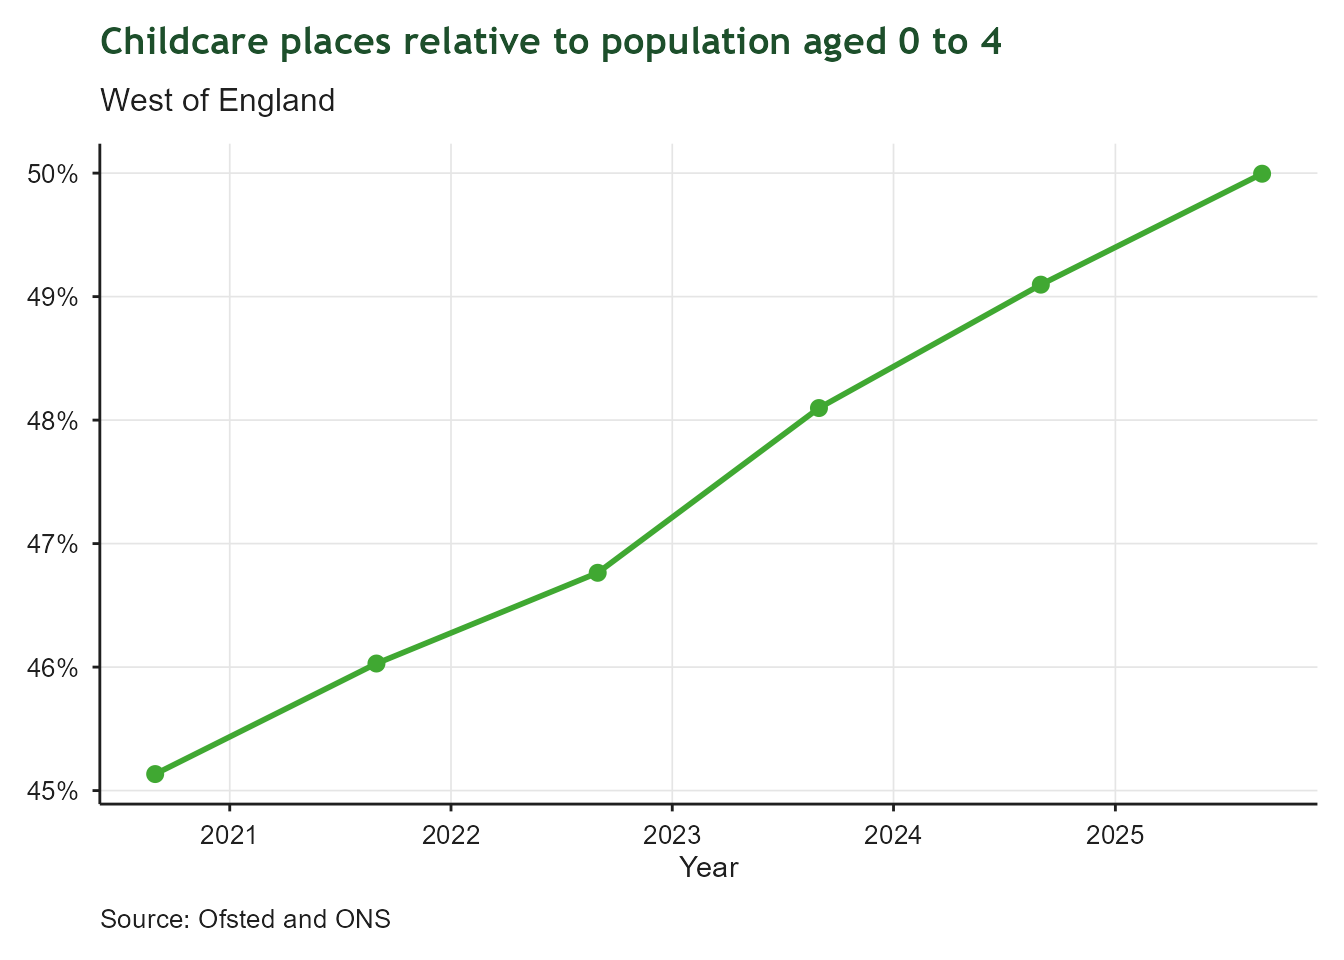
Line and point chart of childcare places relative to the population aged 0 to 4 in the West of England, each August from 2020 to 2025. The x-axis shows year; the y-axis shows percentage. Availability has increased steadily each year, from around 45% in 2020 to almost 50% in 2025, showing gradually improving childcare capacity.

Early Years Settings Rated Good or Outstanding
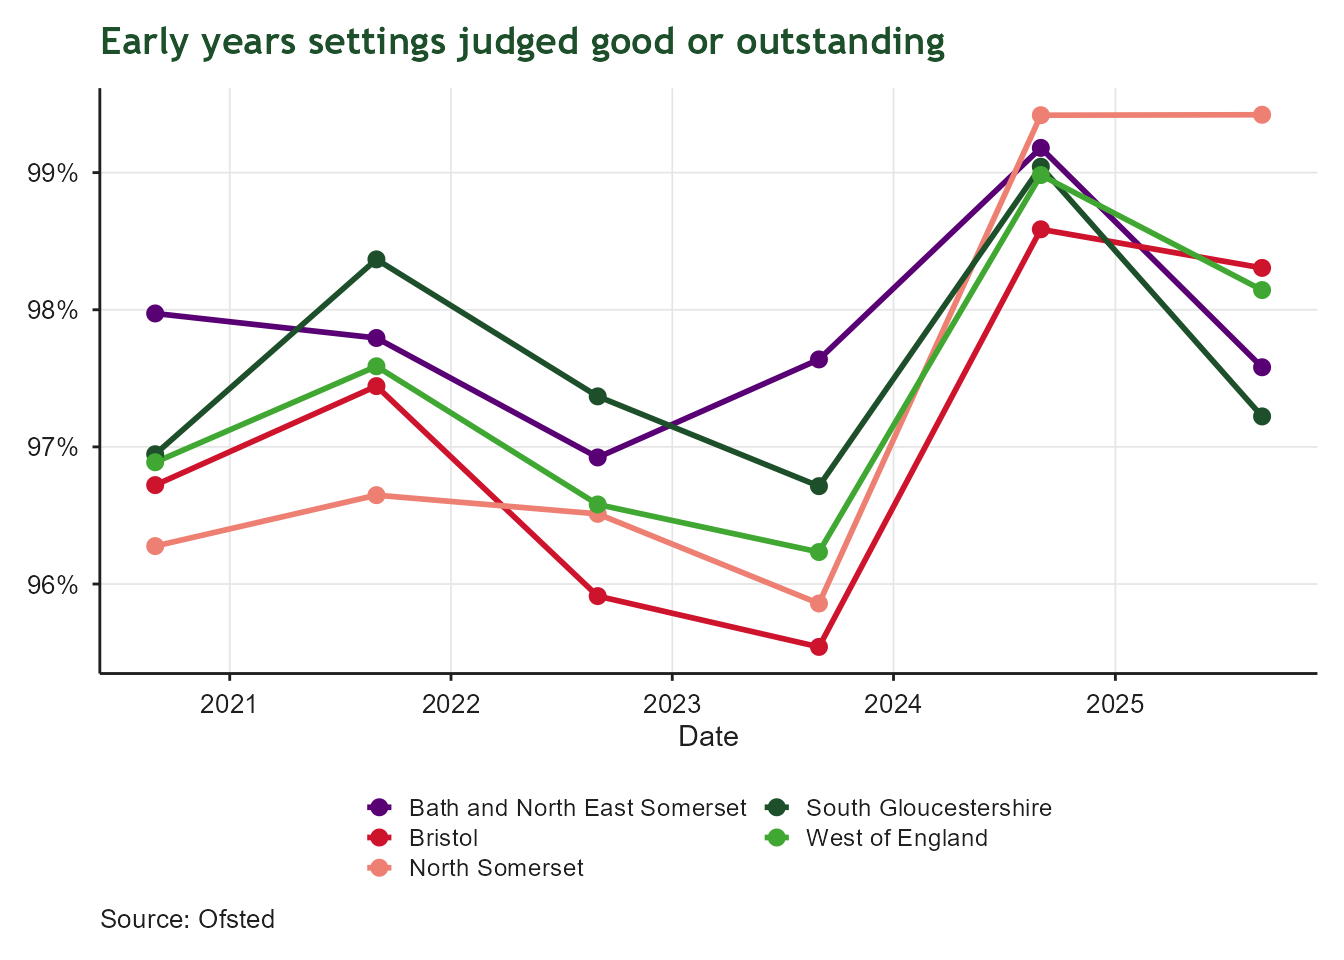
Line chart comparing the percentage of early years settings rated good or outstanding across Bath and North East Somerset, Bristol, North Somerset, South Gloucestershire and the West of England, each August from 2020 to 2025. The x-axis shows date; the y-axis shows percentage, with each local authority shown in a different colour. Quality ratings remain consistently high across all areas throughout the period, with the West of England average staying between around 96% and 99%, showing little change over time.

Life Expectancy Gap

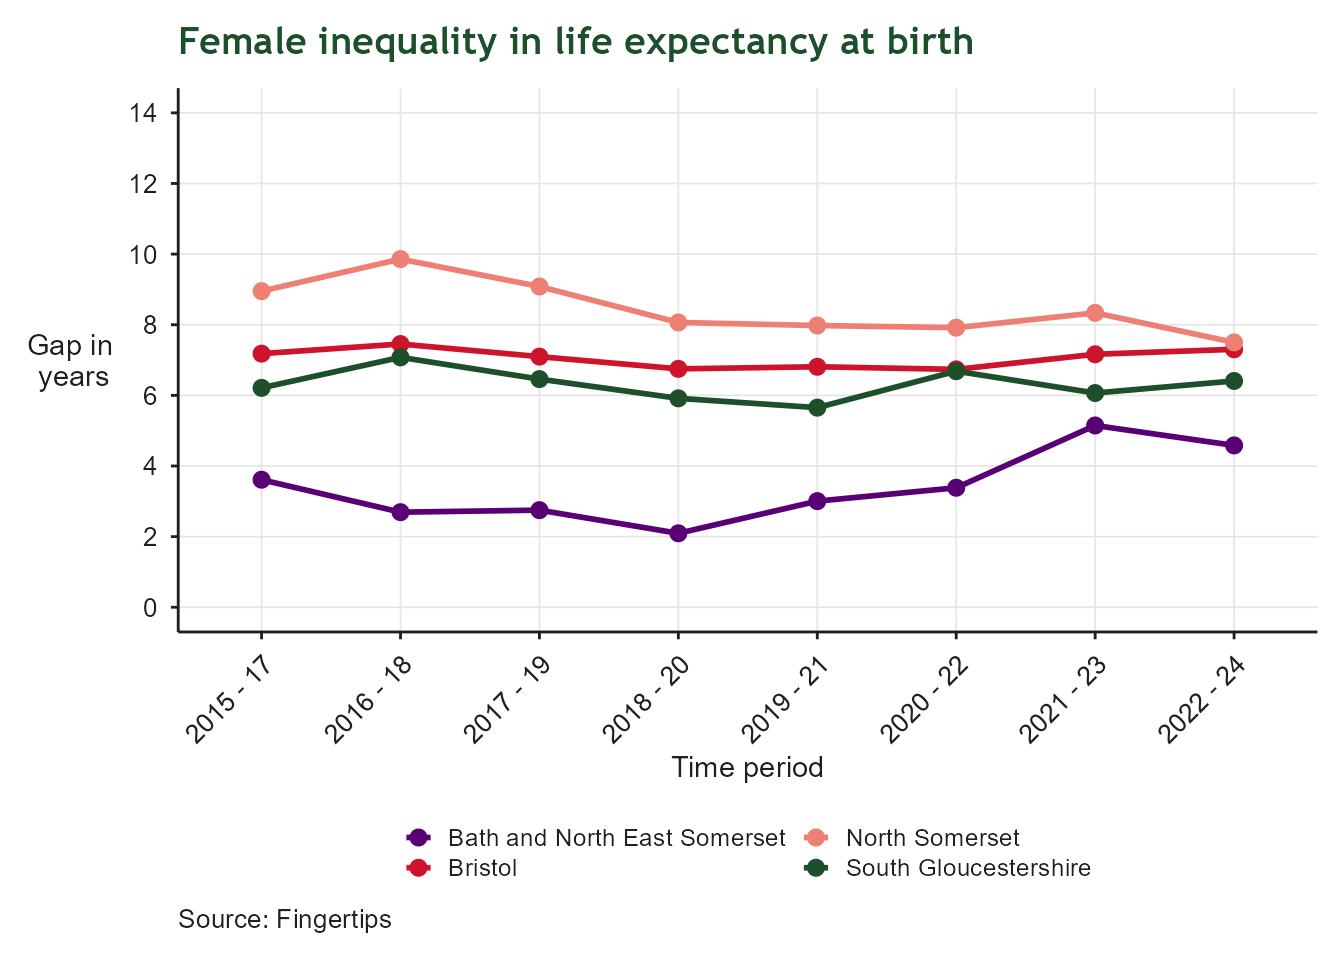
Line chart of the gap in female life expectancy at birth between the most and least deprived areas, for Bath and North East Somerset, Bristol, North Somerset and South Gloucestershire, from 2015 onward. The x-axis shows time period; the y-axis shows the gap in years, on a scale from 0 to 14. The gap differs by local authority, with some areas showing a persistently wider gap than others, indicating uneven progress in reducing health inequalities between women in the most and least deprived neighbourhoods.

Life Expectancy Gap

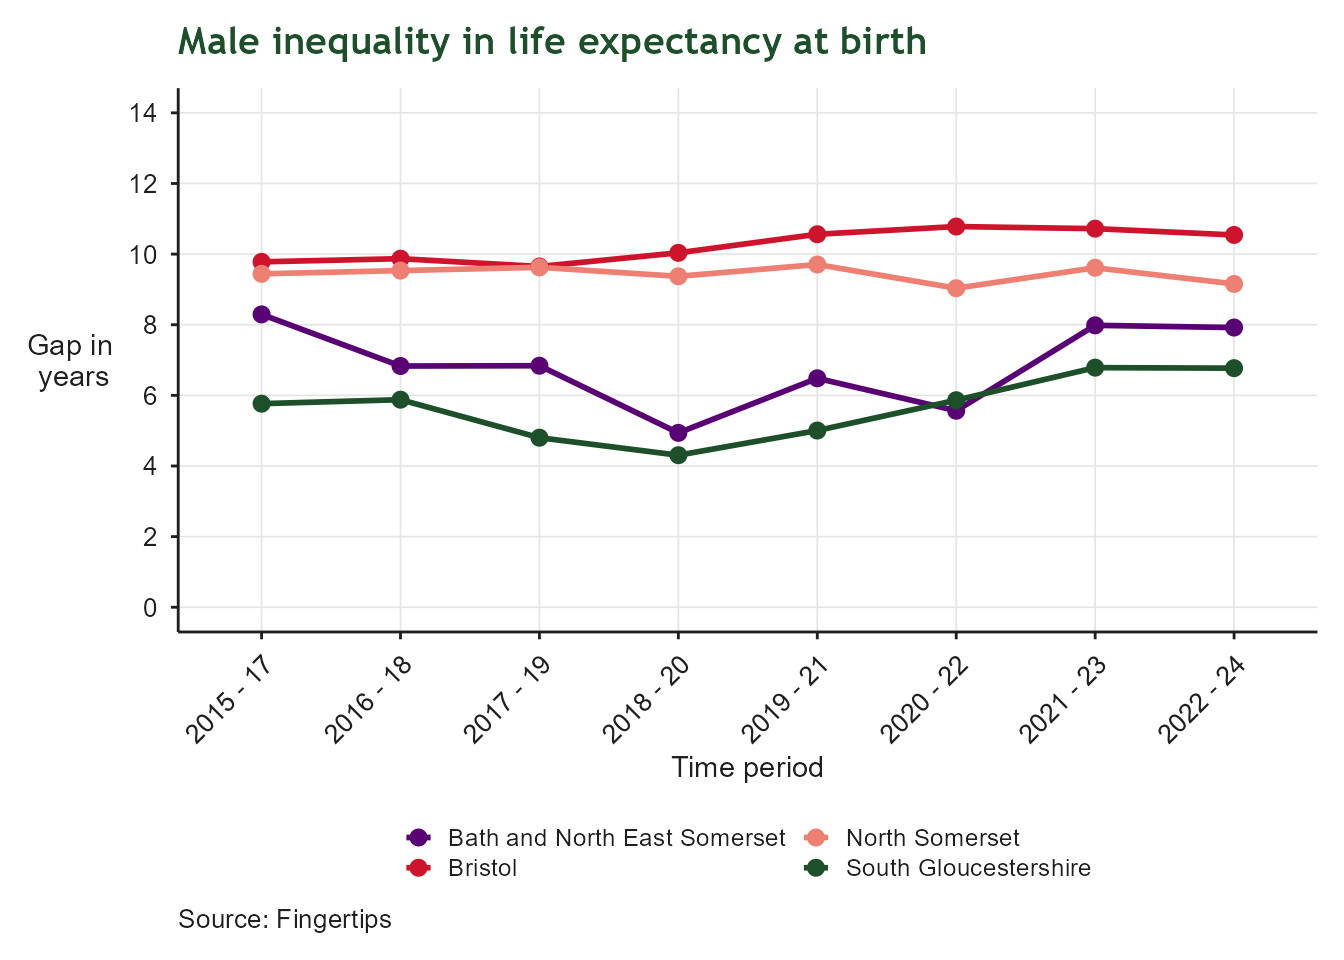
Line chart of the gap in male life expectancy at birth between the most and least deprived areas, for Bath and North East Somerset, Bristol, North Somerset and South Gloucestershire, from 2015 onward. The x-axis shows time period; the y-axis shows the gap in years, on a scale from 0 to 14. Male gaps are generally wider than the equivalent female gaps shown in the previous chart, and vary noticeably between local authorities, reflecting differing levels of health inequality across the region.

Healthy Life Expectancy at Birth

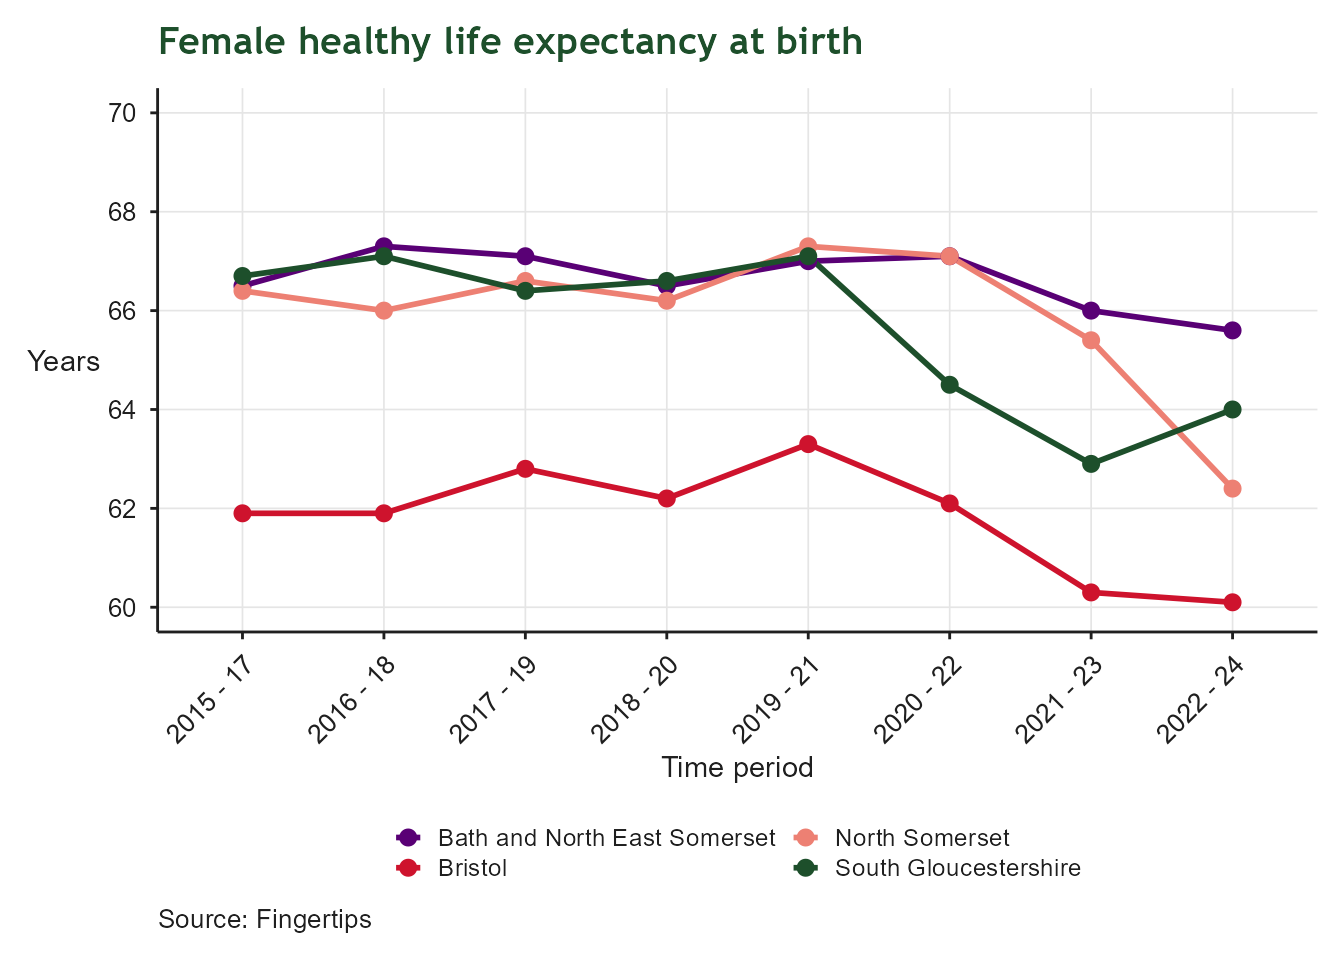
Line chart of healthy life expectancy at birth for women, for Bath and North East Somerset, Bristol, North Somerset and South Gloucestershire, from 2015 onward. The x-axis shows time period; the y-axis shows years of healthy life, on a scale from 60 to 70. Levels differ between local authorities and show only modest change over time, indicating persistent variation in how many years women can expect to live in good health across the region.

Healthy Life Expectancy at Birth

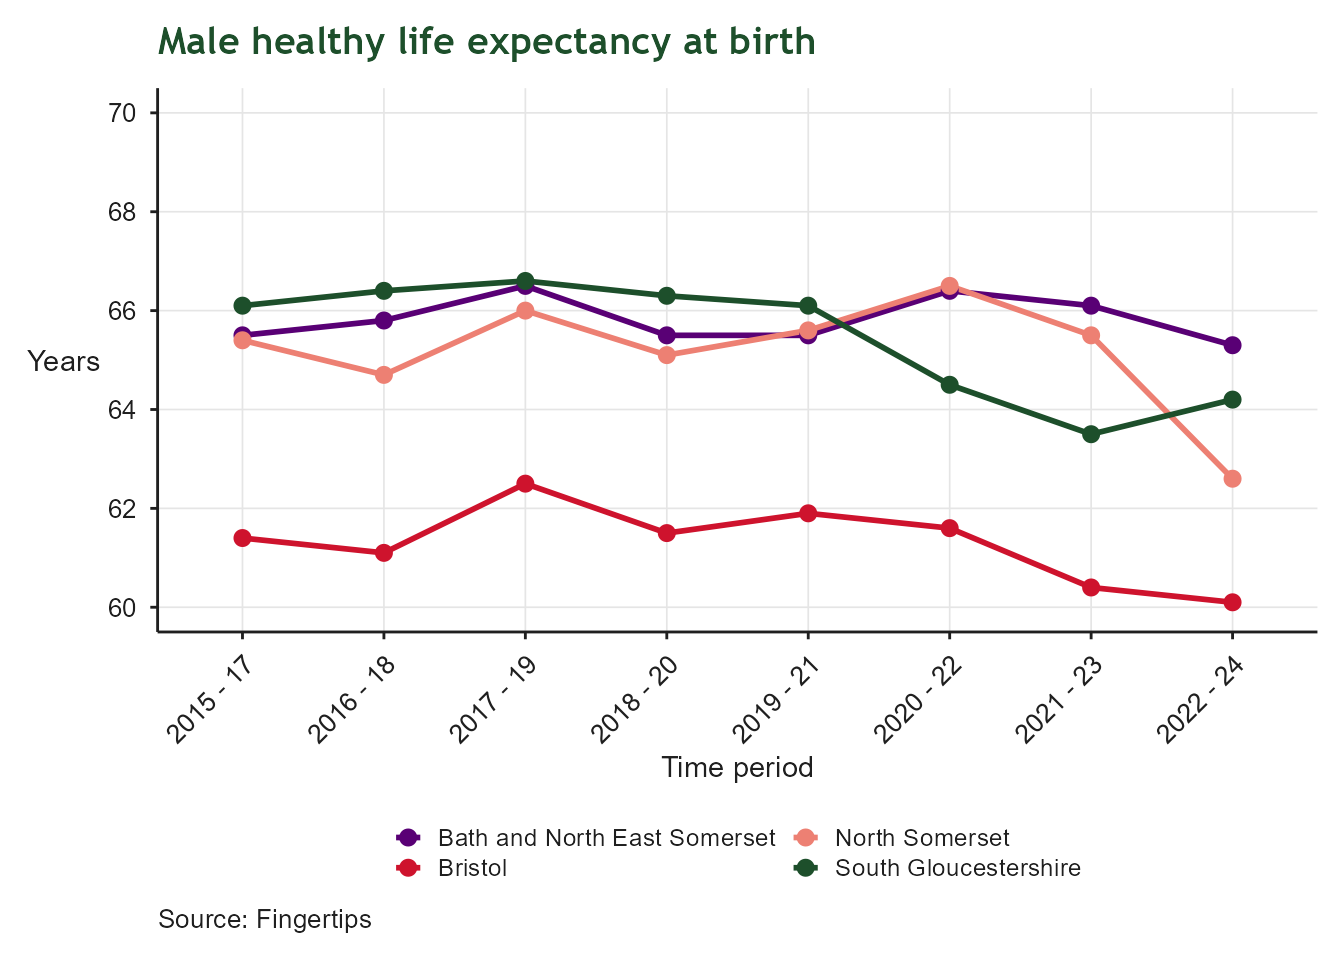
Line chart of healthy life expectancy at birth for men, for Bath and North East Somerset, Bristol, North Somerset and South Gloucestershire, from 2015 onward. The x-axis shows time period; the y-axis shows years of healthy life, on a scale from 60 to 70. Local authorities track fairly close together with only gradual change over time, though a consistent gap remains between the highest and lowest performing areas.

Child Health: Good Level of Development at 2–2.5 Year Review
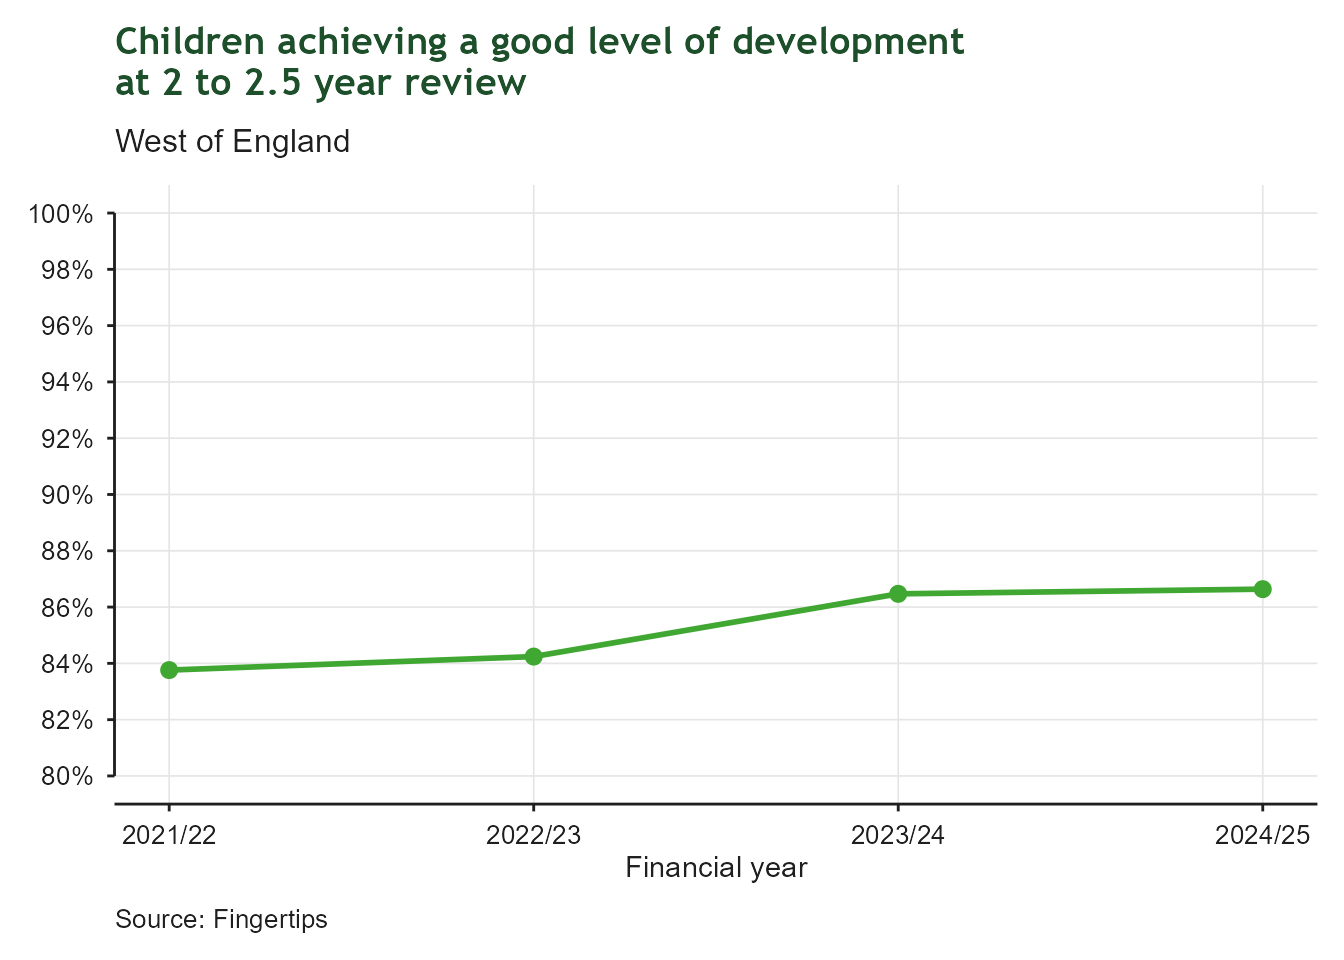
Bar chart of the proportion of children in the West of England achieving a good level of development at their 2 to 2.5 year review, financial year 2021/22 to 2024/25. The x-axis shows financial year; the y-axis shows percentage, on a scale from 70% to 100%. The proportion rose from around 84% in 2021/22 to almost 87% by 2024/25, showing steady improvement in early child development outcomes.

Pupils with Social, Emotional and Mental Health Needs
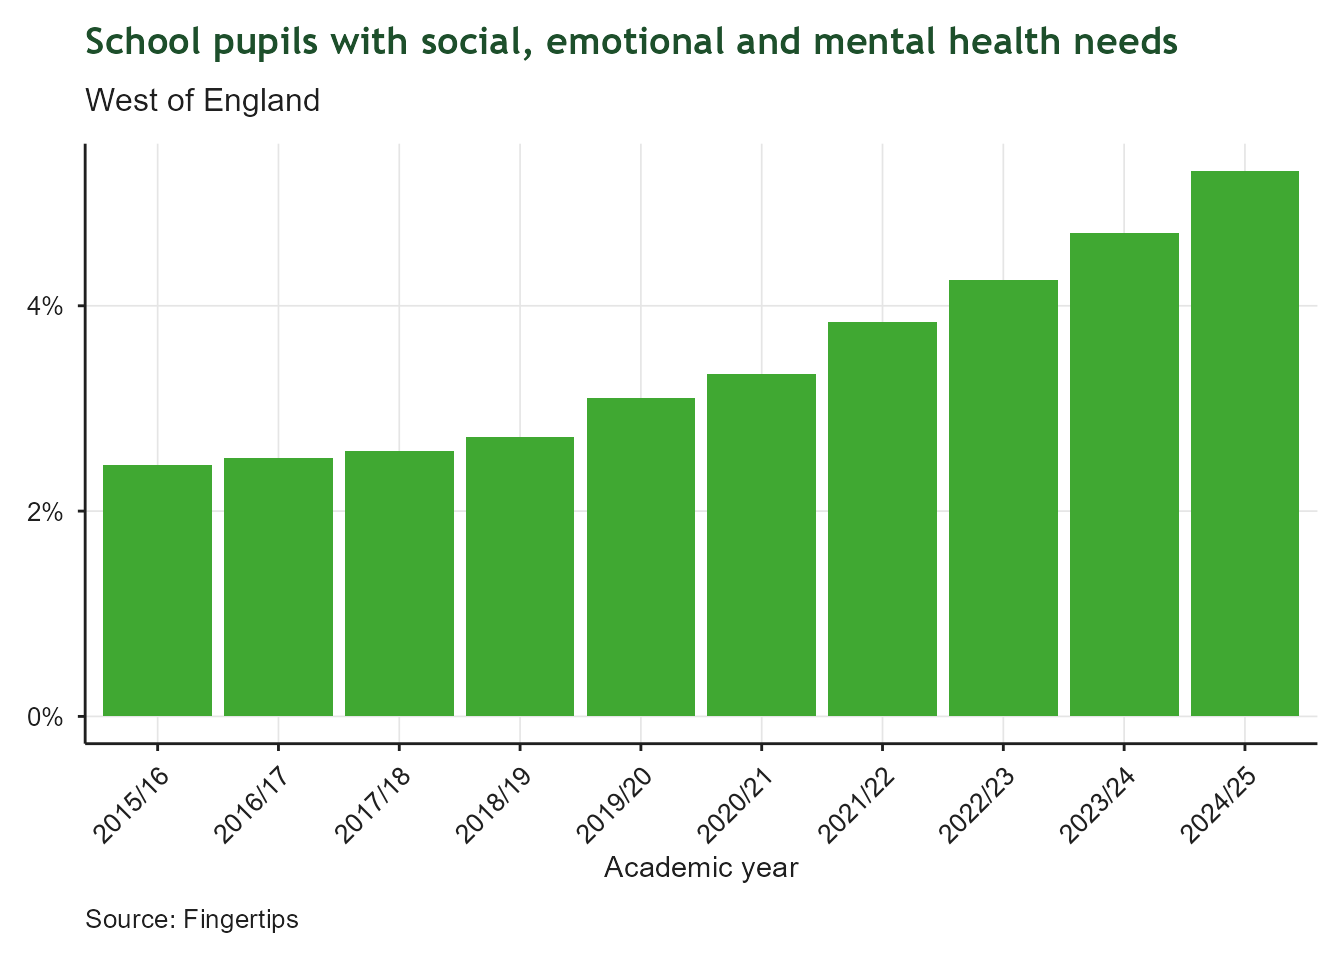
Bar chart of the proportion of school pupils in the West of England identified with social, emotional and mental health needs, academic year 2015/16 to 2024/25. The x-axis shows academic year; the y-axis shows percentage. The proportion has risen continuously and more than doubled, from around 2.4% in 2015/16 to over 5.3% in 2024/25, indicating a growing prevalence of SEMH needs among pupils.